A Detailed Look at the Top 200 CryptoCurrencies | Digital Asset Class Vlog 18
Hello Steemit Community,
Over the past couple of weeks I've been working on a project that would allow me to sort the top 200 CryptoCurrencies into sectors and then keep track of the growth in each sector so that I can better understand the flow of capital in the overall market CryptoCurrency space. In todays vlog entry I'd like to share with you the progress I've made to visually represent the flow of capital in what I now like to call the Digital Asset Class 200 (DAC 200). If you would like to sit back and listen to the details, I've uploaded a video. A written explanation can be found under the video.
If you'd like to save 3% on genesis mining contracts, please use this code: IcqFvi
Video Explanation
The Digital Asset Class 200
As I've spent more and more time in the cryptocurrency space I've wanted to understand the true purpose behind an asset before investing capital into it. Personally, I like to know the purpose for an asset in order to better understand whether or not it is something I believe in. If I believe in an asset, most often I will use the capital I've generated in order to buy it. I like to stay away from assets that I don't personally believe in. So, with that being said, I created a goal to read the white papers from the top 30 assets on "CoinMarketCap". If you are unfamiliar with whitepapers, a whitepaper is a document that someone like you or me can read in order to have a better understanding of an asset's purpose, vision, and direction. After reading the whitepapers of the top 30 assets I began to categorize them based on common goals, purposes, visions and directions. When sorting them I came up with something like this:
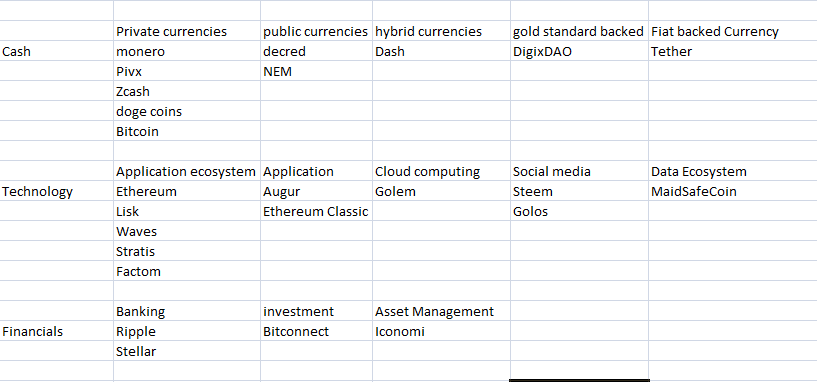
After sorting the top 30 assets I found that the top 30 is responsible for over 95% of the entire CryptoCurrency Marketcap. With that information, I categorized the other 170 assets into their own class labeled "other".
A Dynamic Marketcap Piechart of the Top 200 Currencies by Sector
After sorting the top 200 currencies, my goal was to track the growth in each sector to better understand the movement of capital in the overall Digital Asset Class. What I created was a dynamic market cap piechart that would graphically represent a sector's share of the overall market. This is what I came up with:
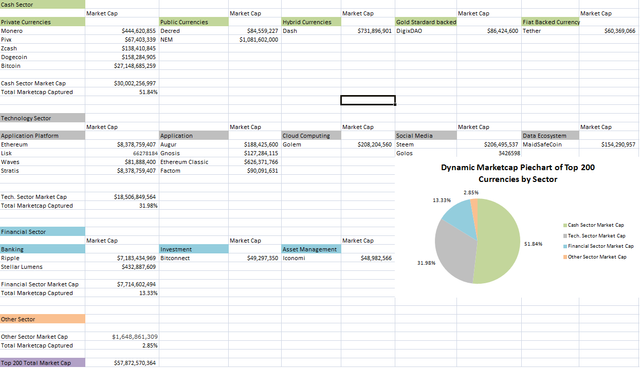
In the image above, you can see the current marketcap in each Digital Asset Sector and the current marketcap in each asset within that sector. The data on this chart comes from CoinMarketCap and is refreshed once every minute. You can see that the overall marketcap of the "Cash Sector" is $30 billion and Bitcoin is responsible for $27 billion of the $30 billion. By adding together each sector I found that the total marketcap of the top 200 assets is almost $58 billion. Since we have the total marketcap of the top 200 assets, I was able to create a piechart that shows the percentage of total marketcap that each sector has captured.
How Do We Use This Information?
The idea is to track the growth from each of these sectors in order to pinpoint which sectors have the highest performance (i.e. has the largest growth over the longest period of time). We can calculate this by recording the percent marketshare of each sector every day and create a graph from that data. So far this is what I've found:
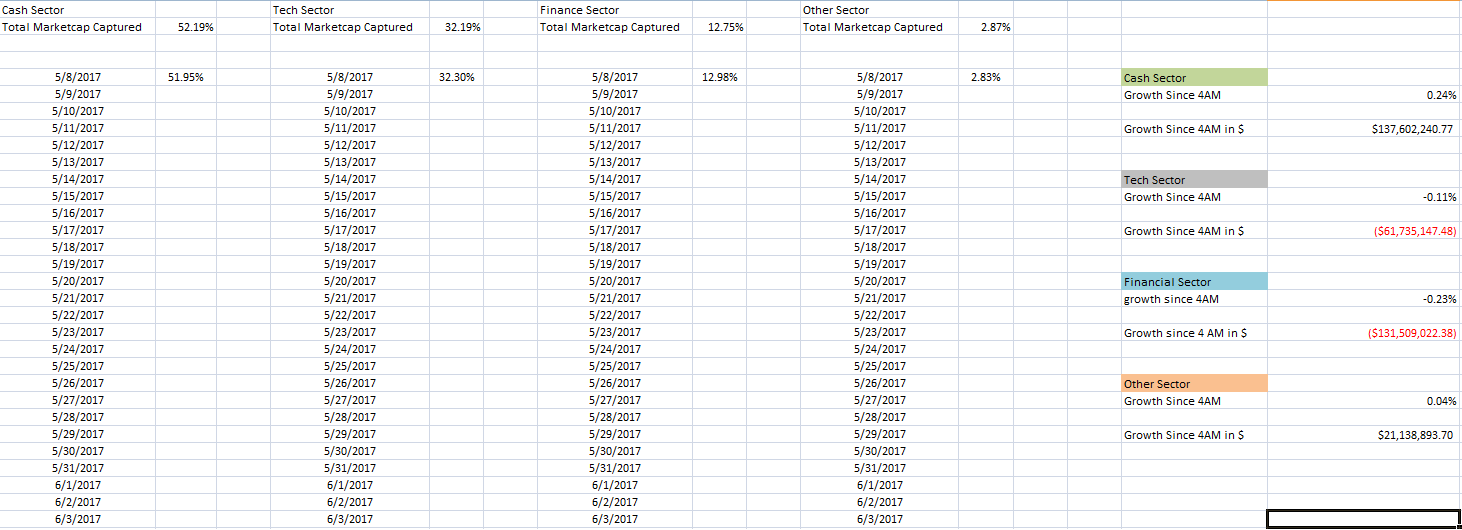
(I found an error with the data that "stratis" was retrieving and fixed it to accurately reflect the current market cap of Stratis)
At 4 A.M. this morning I recorded the marketshare of each sector which can be seen in the cell to the right of today's date (05/08/2017). At the top of the image from left to right you can see the current total market cap captured by each sector (cash, tech, finance, other). Knowing this information we can see that capital is flowing out of the Tech and Financial sectors and into the cash and other sectors. In more detail, this means that capital is flowing out of the Financial Sector (Ripple, Stellar Lumens, Bitconnect,Iconomi) as well as the Tech Sector (Ethereum, stratis, Ethereum Classic, Augur, Steem etc.) and flowing in to the Cash Sector (Dash, Bitcoin, Monero, etc.) and Other Sector (the lower 170 assets). In an attempt to lower volatility I've decided to record data points once a day. I plan to use that information to understand where and when capital is moving in the overall Digital Asset Class.
Thank You for Your Support,
McKenzie Gary

You can help support this project directly by sending to these recieve keys:
Bitcoin: 1FkA6sLYiDb1bqHKC97NX5MhafCeC9YABa
Dash: XcNk2LF6TkEcNtCC4bjVfTykyCcSjrkvVe
Ethereum: 0x9228179bb505F4f70d313A8A29a52E258B9861bA
Litecoin: LLqXH2rkFoW6bxcx86YWBfBd3DGLi8D1p7
Outro: Dr.Holler - Routine
Hey Mckenzie! Great work, I was hoping to do something similar and stumbled upon your video. Is it still possible for you to send over the spreadsheet by any chance buddy? thanks!
I have created a Google Sheet myself to grasp the differences of crypto currencies and your post is very helpful! I'm currently writing on a post that also puts my thoughts on sectors, global economies and features of currencies forward.
Great article, thanks for posting. I was wondering if you could answer how you determined if a currency was private vs public, etc?
Thanks.