Icon (ICX/BTC) + BTC/ETH/LTC Technical Analysis!
Youtube:
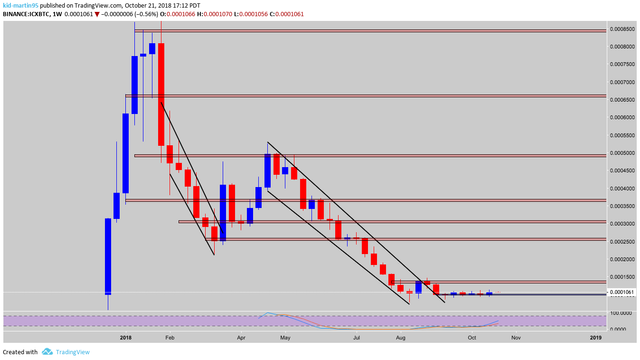
Weekly
Looking at our trend timeframe we see price continuing to respect behavior with no signs of reversal. Support found at 1000 price now looking to test resistance 1500. Stochastic RSI showing momentum in favor of bulls, will watch smaller timeframe for entry.
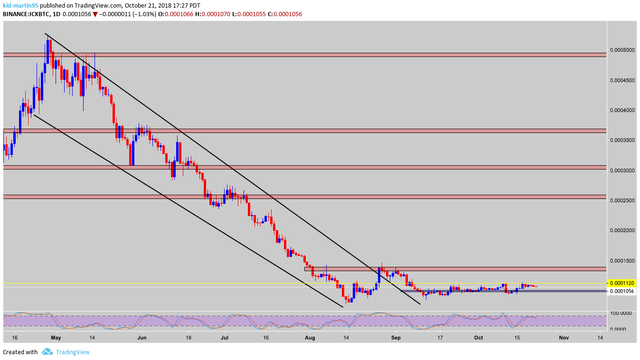
Daily
Shifting over to our pattern timeframe we see price respecting it’s consolidation zone from 1000 to 1100. Stochastic RSI showing momentum is in favor of the bulls, however we are seeing a shift in momentum. A daily close above 1100 activates our trade, a daily close below 1000 and expect another sell off.
Conclusion
- Buy: After Daily Close Above 1100
- Sell: Nooo

Comment Down below what coin you want me to do next! ;)
Thank You for Your Support, Upvote and Follow!!! New Blog and Video everyday
Social Media:
Twitter
Instagram
InvestFeed
Tradingview
Crypto Trading W/ Leverage
How to Draw Trend-lines & Identify Trends
How to Draw Support/Resistance, Price Only
Disclaimer: I am not a financial advisor nor am I giving financial advice. I am sharing my biased opinion based off speculation. You should not take my opinion as financial advice. You should always do your research before making any investment. You should also understand the risks of investing. This is all speculative based investing.
▶️ DTube
▶️ IPFS