Vechain - Technical analysis | Looking for a bounce
Vechain had a lot of momentum in August and we saw it go from being about (0.00002500 ETH) to around (0.00008 ETH) and I think it will break through that point if the trend continues.
So far in September Vechain has been recovering and slowly is going down in value where it is now around (0.000062 ETH). This is very normal as you cannot expect something to only go up forever never having some support or resistance.
I cannot predict where the price of Vechain will go during it's recovery, but I do think that it will continue the uptrend and go even higher than before once it finds a support level.
Day Chart ETH/VET
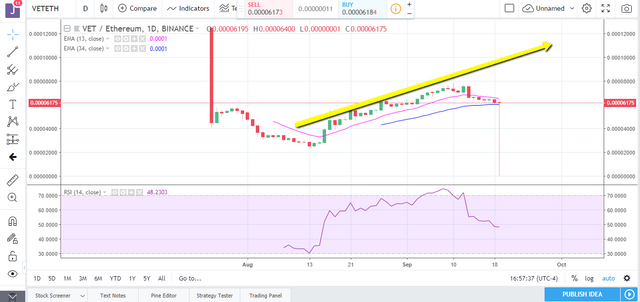
As you can see the day chart for VET trading in ETH there was a lot of green and a lot of profit to be made if you bought where you needed to. Now the red candles are showing more because of it being overbought for so long. We have yet to see a really big red candle so I would trade carefully right now. However my estimate is that it won't go lower than about the (0.00005700 - 0.00006000 ETH) point where I am calling resistance.
Hour Chart ETH/VET
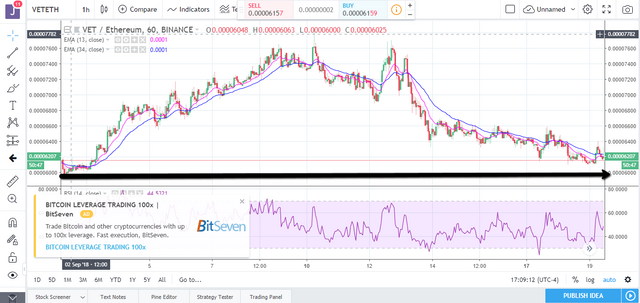
Looking at the hourly chart you can tell that there is a big gap between where it touches one point and will or may touch that point again (soon). Then you should expect to see it have some reaction, probably a bounce up. This is a good time to buy or when it does reach that point I would buy also.
Like I said I cannot predict where the price for Vechain will go and I cannot be a financial adviser. I can only provide my opinion and try to bring information that I think will help.
