We Have Reached Peak Hubris & Insanity in 2018 - the Inevitable Is Coming & America Is Completely Unaware of It
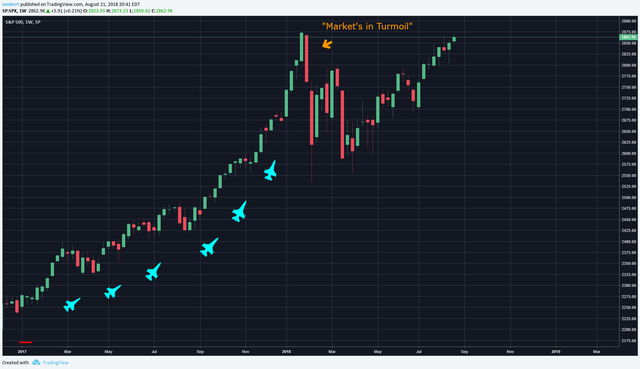
The 2017 U.S. equity market can be summed up as nothing short of smooth. It seemed everyday we were hitting new highs along with President Trump boasting on Twitter about the levels not seen before. VIX shorts were the genius play of 2017, with equities, currencies, and bonds seeing record low-volatility despite the constant North Korea nuclear threat, that the market seemed impervious too. Come January 2018, the market went parabolic and come the first week of February people were shocked to see such a drop. VIX shorts were wiped out and VIX longs that sat under water for a long time made huge margins after 4% drop in the DOW & S&P 500 in that first week of February. CNBC was having a melt down, "markets in turmoil" type of week.
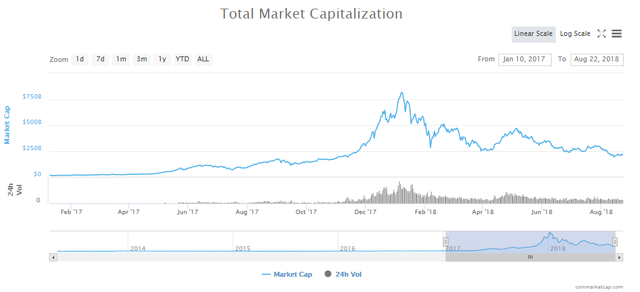
One of the biggest tell tale signs of exuberance was the cryptocurrency bubble that started off 2017 at ~$17 billion and peaked at $833 billion in early January 2018. A 4,900% gain across the market cap itself, with some assets pushing 100,000% percent in that time frame. I wrote about this bubble last summer, but never saw it going up so quickly as it did in November, December, and into January. "Investors" were piling in money into largely worthless initial coin offerings (ICO) in hopes of hitting it big. But like everything in life, the fun does come to an end and eventually there needs to be pain. In no other time would a brand new, completely speculative asset class be able to pop out of the blue like that if it weren't for cheap credit.
The greatest bull run in history has been fueled by low or negative interest rates, share buybacks, and a $4.5 trillion expansion of the Fed balance sheet to jump start the economy during the financial crisis of 2008-2009.
Low/Negative Interest Rates
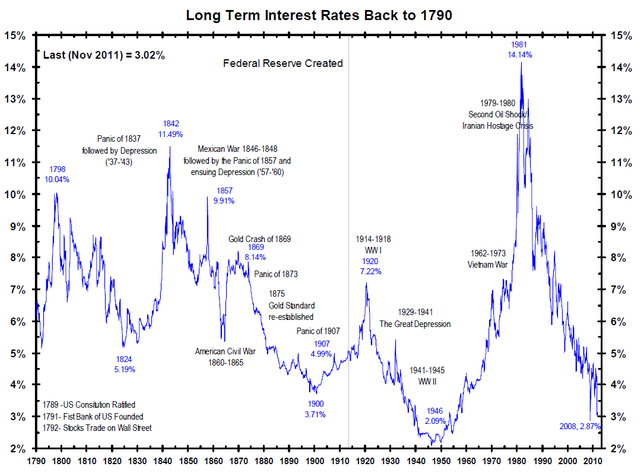
Long-term interest rates have been falling since their peak of 14.14% in 1981. Over the past decade, the 30 year treasury rate has stayed under 5% and for most of that time has been between 2.25%-4%; currently sitting at 2.99% as of August 20th. It doesn't take a rocket scientist to look at the chart below and see that interest rates have risen and fallen over time. Now central banks put controls on these and adjust these rates, but the reality is that when they begin to rise again, pain will be felt everywhere.
Low and negative interest rates allow companies to borrow for cheap, which doesn't give an incentive to saving, because your money is likely to perform better else where, whether it be real estate, businesses, or stocks. Low and negative interest rates allow zombie corporations to survive that get wiped out once interest rates begin to turn north again. A zombie corporation is a listed firm, that has ten or more years of existence where the the ratio of EBIT (Earnings Before Interest & Taxes) relative to their interest expense is lower than one. The company is only able to survive by refinancing it's debt, and it never ends up paying off interest expense, let alone the principal.
Since the recovery began in 2009, zombie corporations have grown from 7.5% to 10%. In Europe, Bank of America (BoA) has estimated that 9% are apart of the walking dead. The Bank of International Settlements (BIS) has warned against the collateral damage that extremely loose monetary policy will have down the line.
Though this share of zombie firms can be perceived as small, since 89.5% are not apart of the walking dead, there are some worrying stats that can't be ignored. Per Moody's and Standard's and Poor's, debt repayment capacity globally has weakened globally despite the low interest rates and high amount of liquidity. The BIS only analyzes listed companies, which means there is a large swath of unlisted companies not in their statistics. In the Organization for Economic Co-operation (OECD), 90% of the companies are SME's (Small & Medium Enterprises), and a good chunk of those companies are not listed, and of those, a lot are taking on water, without pumping it out. In the Eurozone, the European Central Bank (ECB) estimates that 30% of SME's are still in the red. Furthermore, in the U.S. it is estimated to be 20% and in the U.K. at 25%.
Despite what some say, the rise of the zombie corporation is not a good thing. They may argue that it is "keeping jobs alive", but all it is doing is kicking the can down the road. It takes away from the productive and gives to the unproductive. This creates a contradictory incentive, protecting nothing in the long run. Companies that under perform get their debt refinanced while companies performing well struggle to get access to credit. When cheap money ends, the zombies will be the first to collapse and the higher productivity companies will see equal damage second as their growth was limited during the growth years.
One would think all this liquidity and low rates would help companies deleverage, but unfortunately it has done the opposite. Currently, global debt to GDP at 325%, hitting an astonishing $247 trillion ($247,000,000,000,000 - extended this to show the enormity of it.)
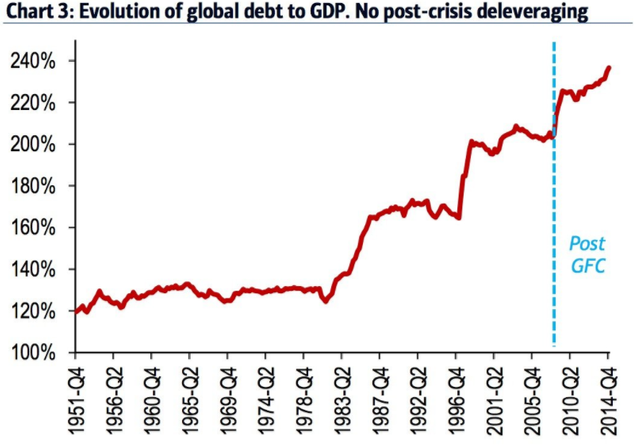
Global debt since the 1980's has far outstripped the growth of global GDP, increasing nearly 90% in the last four years. Even after the Global Financial Crisis (GFC), we did not see any pull back on debt, only further increase in leverage. This leverage is now still out there as the Federal Open Market Committee (FOMC) continues to raise rates. Starting on December 15th, 2015 FOMC raised the federal funds rate from 0.25% to 0.5%. The first time it moved since the 2008 recession after sitting at basically zero for seven years. As of August 1, 2018 FOMC raised the fed funds rate to 2.0%, with intentions to increase it to 2.5% by the end of 2018 and up to 3.0% sometime in 2019. The fed funds rate controls short-term interest rates. These include the prime rate, most adjustable-rate and interest-only loans, and credit card rates.
$4.5 Trillion Expansion of Fed Balance Sheet
Back in 2008, Fed Chair Ben Bernanke began the Quantitative Easing (QE) program, which worried many investors who suspected hyperinflation would be seen akin to the crisis in Germany in the 1920's and what happened in Zimbabwe where being a billionaire meant you were poor. Instead of injecting cash straight into the economy, the Fed picked up Treasuries and mortgage-backed securities (MBS). Now that the Fed has began to allow some of these assets to mature, beginning in October 2017, we are only seeing the beginning of what havoc this will cause.
The Fed's balance sheet consisted of roughly $4.53 trillion worth of Treasuries and MBS in July of 2017. The Fed used these to jump start the economy in the post GFC world and to create a wealth effect that would hopefully find it's way to riskier assets, mainly stocks. The big issue the Fed is facing here is how to prevent a sharp rise in interest rates, which would thus cause a tumultuous roller coaster in the stock market after contracting their balance sheet back to normal levels.
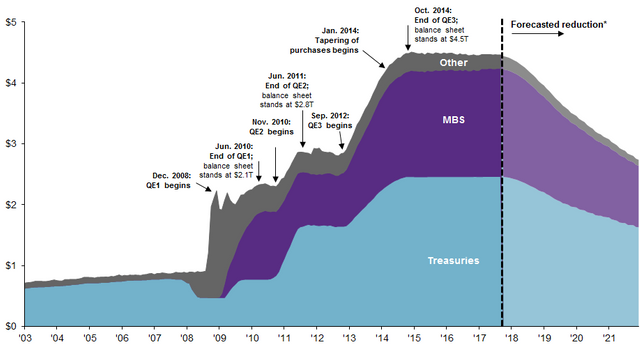
Of the $4.5 trillion, $3.7 trillion came post GFC apart of the QE, which is essentially money printing. Most of the money printing is digital, coming from nothing and will essentially return to nothing. These are the times we live in, where the Fed creates artificial wealth to promote a recovery which really just creates more inflation and causes more pain down the road. The pain is near and the Fed has barely raised interest rates this time around and when this crash comes, will they move interest rates back to practically zero? This will just further kill the dollar, which has lost 96% of it's value since 1913.
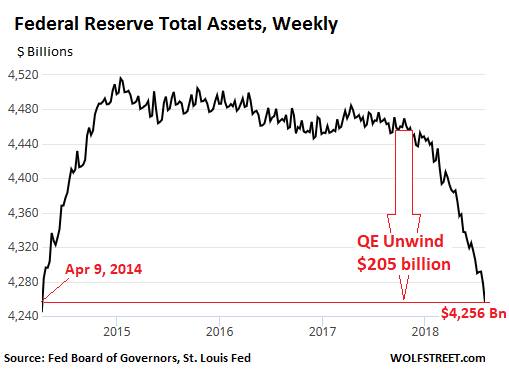
The Fed's plan for the "unwind" calls for shedding up to $420 billion in securities in 2018 and up to $600 billion a year for the following years until the balance sheet is "normalized". The Fed's balance sheet has dropped over $205 billion since it began unwinding last October, bringing the balance sheet to the lowest levels since April 9, 2014. It took the Fed six years to pile on the Treasuries and MBS, and now it will take a few years for it to unwind. Goldman Sachs has estimated the balance sheet will shrink down to $2.6 trillion to $3 trillion by 2021.
The Fed is stuck in a limbo here, trying to unwind back to "normal levels" without bringing on a huge shock to the economy or stock market. If they pull it off they will be hailed as heroes, if they do not, they will be deemed reckless. It will likely fall as the latter as there is only one way for this to end, with blood.
The ugly truth is that the whole recovery has been fueled by nothing but the printing of money out of thin air. With the S&P 500 making over 300% return since the GFC, in reality once you account for the inflation caused by the Fed, we are simply just breaking even now. Inflation makes people feel good and drives up household net worth. Their assets like stocks and real estate balloon, which we've seen hit records in both. New highs for stocks across the board and real estate prices in cities like San Francisco have become so expensive that tech engineers living off +$125,000 salaries can't make ends meet.
Consumers feel wealthier so they spend more money and think that their wealth will continue to grow, until it won't. Just to show the disconnect, the Target CEO, Brian Cornell went on to state this on CNBC yesterday:
"This is the best consumer environment 'I've seen in my career'."
That will be timestamped and remembered as an idiotic comment at the top of the bubble. This is akin to when Ben Bernanke went onto say at the Fed meeting in early 2008 that it does not "forecast a recession." We all know how that ended.
Some Fed critics speak about the reality of coming tide that is inevitable, as Peter Boockvar, chief market analyst at The Lindsey Group stated:
"I have a bridge to sell you if you think a rate hike cycle combined with a shrinking balance sheet will go smoothly. If the exit process ends up turning messy — defined as a recession and bear market in stocks — was all this easing worth it? Be bullish if you think both news stories will turn out just fine. Be very worried if they don't."
Share Buy Backs
Share buy backs have played one of the biggest roles in propping up the market. With the recent tax cut, many public companies took liberty to buy more shares back to reduce the amount in circulation thus causing greater demand for the shares that are out there floating. In 2018 alone, U.S. companies are on pace to break $1 trillion in buy backs by November according to Trim Labs Research. Year-to-date as of August 17th, companies have bought back $769 billion worth of shares.
The previous record for annual share repurchase was $809.6 billion in 2007... what happened in 2008 and 2009 again? Oh yeah, the collapse of the global economy.
For Q2 2018, U.S. companies reported on average $3 billion in share buybacks per day versus $3.5 billion per day for the previous eight reporting seasons.
Conclusion
With both Emerging Markets and the Chinese stock market in a bear market since the beginning of 2018, it seems U.S. market is making it's final leg up. Though most stocks haven't performed that well since the initial shock in February, FAANG stocks, which account for half the weight of the S&P 500 have continued to drive it from it's February & March lows back to the January peak. We are currently sitting at that peak, will we go higher? Personally, there are way to many things to be bearish about at the moment including U.S. national debt exceeding $21.2 trillion, student debt exceeding $1.4 trillion, and auto loans exceeding $1.22 trillion, it's only a matter of time before The Everything Bubble implodes.
If you liked this content, please upvote, comment, share, and resteem it!
Follow me @investoranalysis
Follow me on Twitter @Brett_Kotas to stay up to date with the market.
Follow me on Instagram @crypto_coitas to keep up to date on market.
Thanks!
Check out my website and my Contributor site, Influencive.
Disclaimer: The views expressed in this article are solely the author or analysts and do not represent the opinions of the author on whether to to buy, sell or hold shares of a particular cryptocurrency, cryptographic asset, stock or other investment vehicle. Individuals should understand the risks of trading and investing and consider consulting with a professional. Various factors can influence the opinion of the analyst as well as the cited material. Investors should conduct their own research independent of this article before purchasing any assets. Past performance is no guarantee of future price appreciation.
Congratulations @investoranalysis! You have completed the following achievement on Steemit and have been rewarded with new badge(s) :
Click on the badge to view your Board of Honor.
If you no longer want to receive notifications, reply to this comment with the word
STOPTo support your work, I also upvoted your post!
Do not miss the last post from @steemitboard:
SteemitBoard and the Veterans on Steemit - The First Community Badge.