Are you learning harmonic patterns? Our guide to the Gartley pattern.
Hello Steemians!!
Lately IDC has been focusing much more on technical analysis and the benefits it provides traders. As we research and learn new strategies, we want to share patterns we find with our followers as well as why those patterns are relevant and how to find them yourselves.
This week we’ve done a lot of work with the Gartley pattern. This pattern is a “retracement and continuation pattern that occurs when a trend temporarily reverses direction before continuing on its original course”. Having two versions depending on whether you are in a bull market or bear market, the Gartley pattern is “one of the most” used patterns by traders. This pattern specifically gives investors a good indication of what to buy, where their entry point should be and where to get out based on a number of targets.
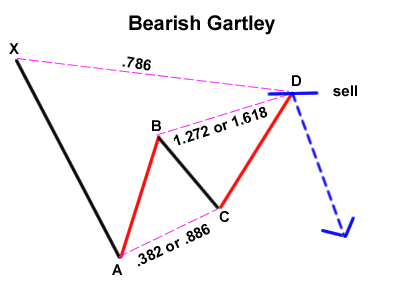
The pattern formation for the continuation of bear market looks similar to the image below.
(Image Credit)
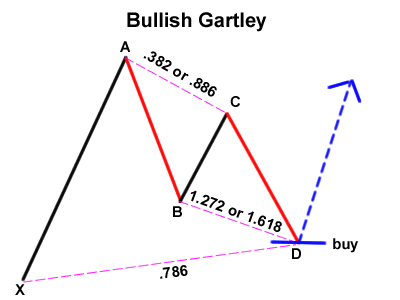
While the pattern formation for the continuation of a bull market would look similar to this:
(Image Credit)
Building on the ABCD pattern most traders are familiar with, the Gartley setup includes an X variable preceding the ABCD pattern.
According to the trading rules site babypips.com the “perfect” Gartley pattern will have the following characteristics:
- Move AB should be the .618 retracement of move XA.
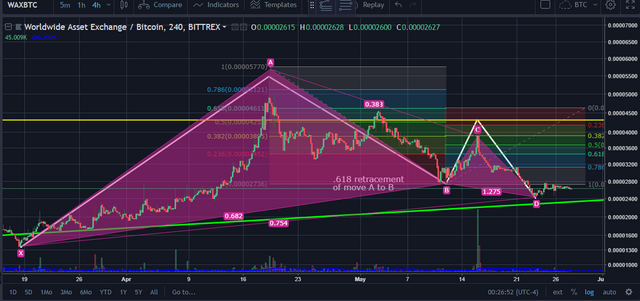
- Move BC should be either .382 or .886 retracement of move AB.
- If the retracement of move BC is .382 of move AB, then CD should be 1.272 of move BC. Consequently, if move BC is .886 of move AB, then CD should extend 1.618 of move BC.
- Move CD should be .786 retracement of move XA.
The rule-set can vary quite significantly depending on which site you reference. An example of this is that one site says that point C must at least wick to the .618 retracement of AB, which would rule out some of the potential patterns derived from rules above(ie. they only met the .382 retracement). If point D as defined by rule #3 above(the 1.272 extension or 1.618 extension of BC) is beyond the .786 retracement of XA, price action is perhaps unlikely to reach the .786 of XA. However if the extension levels are within the .786 retracement of XA, the pattern is more likely to complete at the extensions of the BC leg. Ideally, the .786 of XA would match with the best extension level of BC(as defined by the third rule above), which is known as confluence. In this case, there is confluence with the .786 retracement and the 1.27 extension. It's not perfect, but extremely close.
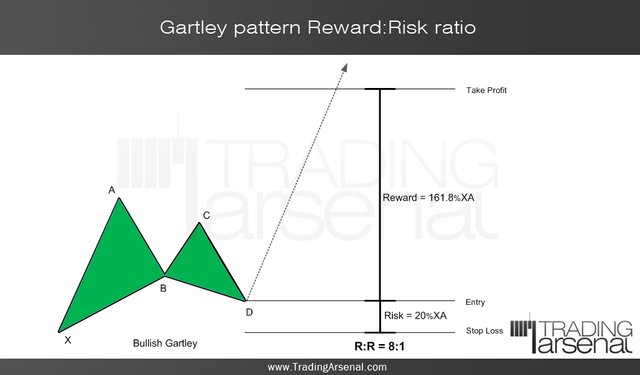
There are always somewhat clear rules for disqualification of the patterns which must be noted as well, which we can use as stop-losses or targets depending on the trade. In this case, for example, point B MUST NOT exceed X, and some guides suggest the .786 retracement of XA being the disqualification point for B instead. With the Gartley pattern, the stop-loss is usually placed near point X, which gives a risk to reward ratio of 8:1 when compared to the target of 161.8% XA, as illustrated below.
(image credit)
Until last week I had personally never heard of the Gartley pattern and as far as charting experience I’ve only just begun to be comfortable with the basics. My charts often respond well to the indicators I’ve familiarized myself with and I enjoy being able to share those ideas with our followers. With the help of Tommy Tourettes (@MyEmpireOfShit) I was able to find the Gartley pattern on the 4-hour chart of a token I’ve been invested in myself for a few months, Worldwide Asset Exchange (WAX).
To begin, let’s look at how I found the Gartley Pattern.
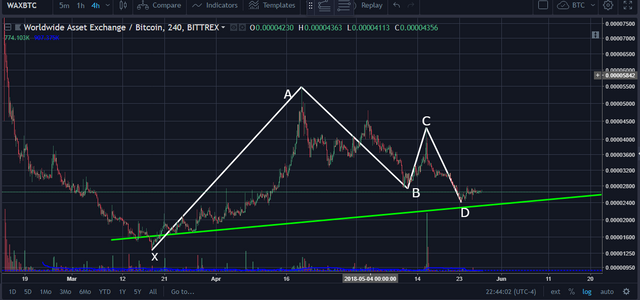
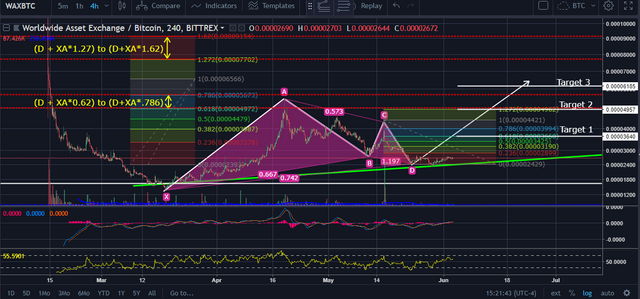
First, I looked for the “impulse leg” which is defined as a “clear move in one direction or the other”. In the case of price action for WAX, a bull trend began mid-March this year, for the purpose of this chart I’ve labeled this move X to A.
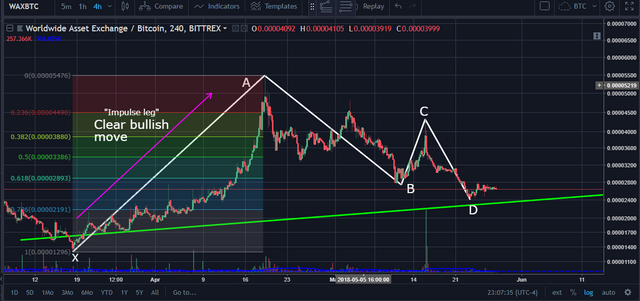
About a month later, just days after I’d bought into WAX myself, a strong reversal took over with bears driving the price back down significantly. I’ve labeled this move A to B. Had I known about the Gartley pattern then, I may have realized this was a near perfect .618 retracement of move X to A (indicated by the yellow horizontal line in the screenshot below).
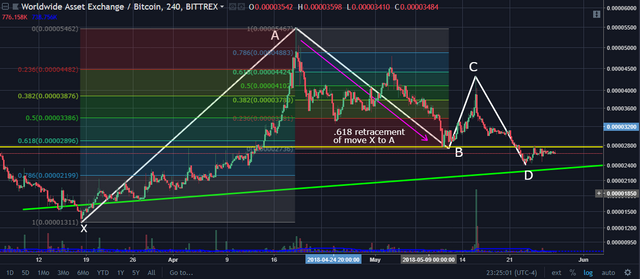
Price action then rose to the .618 of A to B giving us our B to C leg and then fell to the .786 of the X to A leg completing the Gartley pattern by giving us D. Ideally, there will be confluence with the .786 of XA and the 1.27 or 1.68 extension
Now that the pattern is complete we look for targets. To do this, I have personally learned to determine these targets by drawing a trend based Fibonacci from D to C, then back to D. 2 targets using the method would be between .618 and 1.272 of the C to D extension.
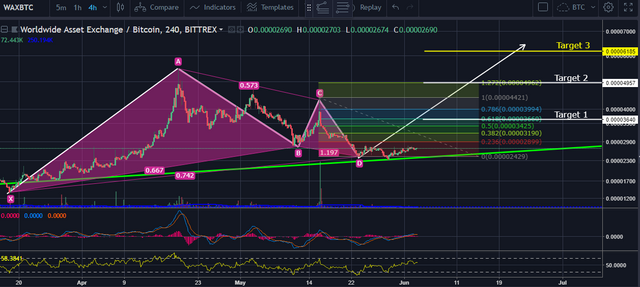
Another target could be highlighted by using the arrow tool to create a line from X to A then bring that line to point D. This common target for this specific chart would have price action reach beyond 6300 SATS. Marked in yellow target 3 would make a profit of over 160%.
As a final note, as with the rules that define the pattern, many traders and analysts define the pattern's targets with a different set of rules. For instance, some trading tip sites such as StockCharts.com suggests that in a “Gartley bullish pattern, the target zones are computed using XA leg from the trade action point (D)”.
Mathematically that can represented as:
Target Zone1: (D + XA*0.62) to (D+XA*.786)
And
Target Zone2: (D + XA*1.27) to (D+XA*1.62)
These targets are illustrated on the left below, indicated by the dashed red lines.
Learning this pattern was certainly a unique experience and I hope to become more proficient at it as use it more. In the future I hope to learn other harmonic patterns such as the Bat pattern and the Harmonic 5-0 pattern, as I do I’ll be sure to share my lessons here. These charts are of course not financial advice however they can be used as guidelines as your learning and developing your own style.
Should you choose to follow this chart you can find it here.
Knowledge is power.
°Br¡tT^N¥° (@TheJadeCrow on Twitter)
Very good application for checking cryptocurrency and receive notifications https://masscoinapp.com