Litecoin at crossroads: 1 hour timeframe analysis
Litecoin price chart shown in this analysis is a 1 hour time frame from August 4, 2018.
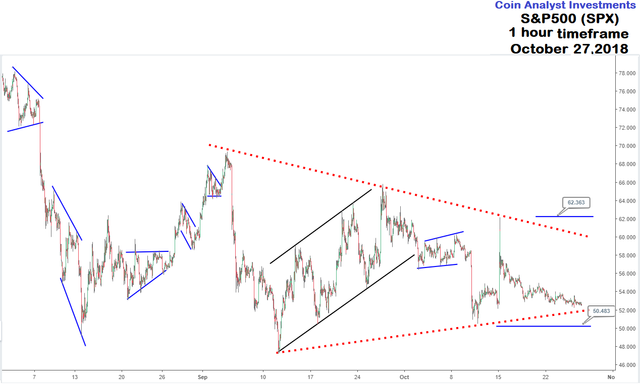
Price action from September 4, 2018 to date is described using as a symmetrical triangle; a chart pattern that ideally indicates stalemate between demand and supply.
~$62.36 and $50.48 are indicated as price levels to pay attention to as a break above the former implies resumption of bullish strength, while a break below the latter indicates further lower prices in Litecoin.
The width of the chart pattern is valuable in providing a minimum estimate for projection of the price following a confirmed breakout.
Interested in Bitcoin analysis (BTCUSD)? Check out our previous work below
https://coinanalyst.investments/2018/10/15/bitcoin-analysis-8/
Moreover, XRP chart analysis (Ripple) can be found here:
https://steemit.com/trading/@cryptotrader0029/ripple-analysis-today
All these charts never make sense to me. How does this influence the price going forward 💯🐒
It does not meant to influence price going up. It is meant "paint a picture for you" so that you do not lose money you invest. More details can be found via the website on my profile. Thank you
Thanks will take a look when I have a minute. I only have a few hundred invested can't afford any more at the mo. Thanks again 💯🐒
You are welcome and it is better to have a plan going on for you and also be able to step back and look at a longer timeframe when smaller time frames present a much of a challenge
Sound advice 💯🐒