BTC Daily Chart update - May 21, 2018
https://www.tradingview.com/x/WbJ5OFiG/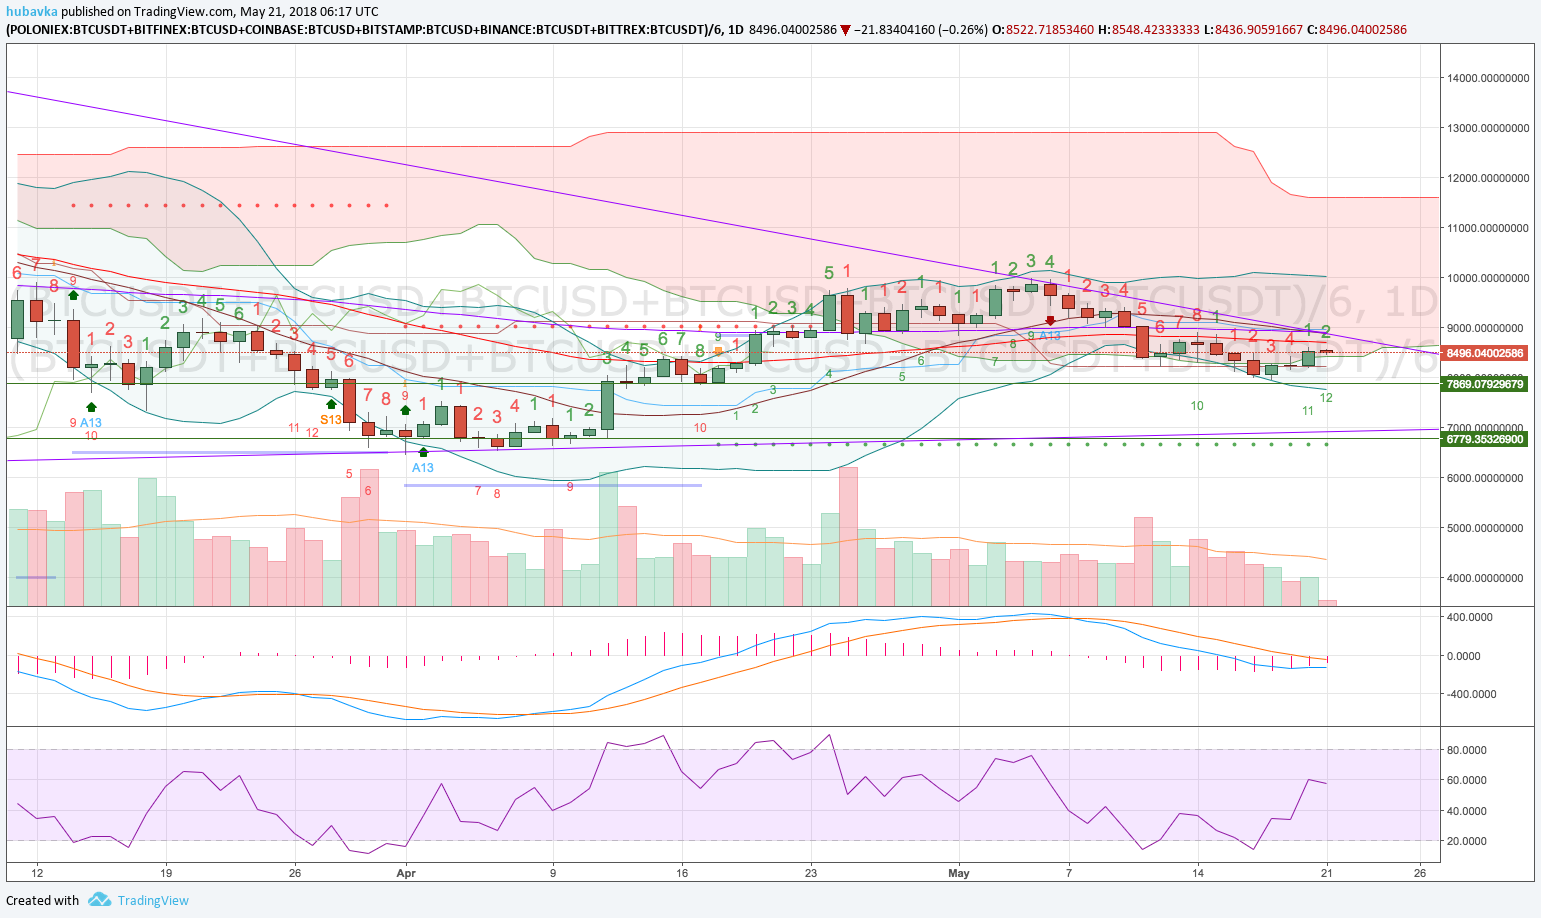
The recovering continued yesterday with $300 green candle. TD had a price flip to a green one. If we trade today above $8,600 there will be a daily buy signal based on the TD Indicator. 50 day EMA is currently near $8,700 which should act as resistance. The middle of the BB band and the down trend line come at around $8,870. If the price is able to get over all of these prices the medium term will turn bullish. More likely scenario is that we will continue to consolidate in the $8,000-8,800 area.
I enjoyed reading your article.
Agree with all you've said. I'd add that the daily Hull MA has turned green, which I've not seen faked out so I give it some weight, also the StochRSI has lifted from a double bottom where it's been for the last week plus, and the multiple time frame RSI divergence has stopped wicking. A lot of good indicators, but too early to be confirmed. Climbing over 8900,9000 will clearly be a huge boost in confidence to a recovery.
please upvote me. already upvote you.
Say something more useful and related to the post to get an up vote.