This is where crypto millionaires are made - Elliot Wave and Bitcoin's 720-day bull market
Market lows after a corrective move are rife with hopelessness and fear. But these are exactly the times when people should be buying. The only thing bearish about 2018 was the price - a significant amount of the accumulation of Bitcoin has been through large OTC (over-the-counter) 'block' transactions (generally a minimum of $250,000 worth of BTC per block). Do you think it's a coincidence or happenstance that the largest amount of institutional investment and capital ever invested happened when Bitcoin was giving up the greatest discounts? No. When people say 'buy low, sell high' - this is where the buying is happening.
The 720-day bull cycle and the 400-day bear cycle
For a larger image, click here
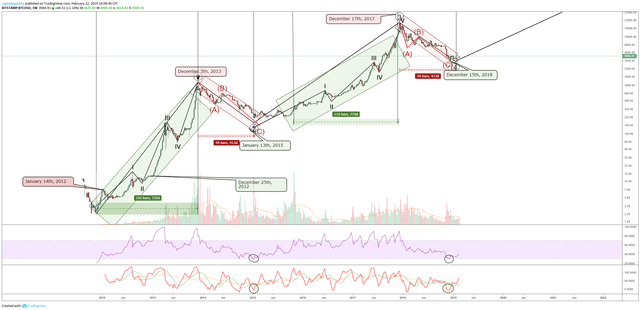
The all-time high of Bitcoin, $19,898 was made on December 17th, 2018 – over one year ago. If we look to the past we can see that dates around December 17th have also been of historical importance. The first swing high on this chart was found on January 14th, 2012. Another major swing prior to the first major rally occurred on December 25th, 2012. One year from that date range, we saw the 1st major and important swing high in Bitcoin made on December 5th, 2013 – which coincided with the Mt. Gox debacle. The low for the 413-day bear move was found on January 13th, 2015.
The green diagonal boxes represent the gradual (for Bitcoin ) rise and gradual increase in value that Bitcoin experiences prior to a major parabolic move. For both of those highlighted green box zones, we observe not only a very similar range of days (735 trading days VS 764 trading days), we also see a similar price and structure. When we look at the red highlighted boxes, we observe an even stronger correlation.
The red highlighted boxes have an almost creepy similarity. It’s uncanny. If we measure the peak of the first red box to the low, the downside lasted for 413 days. If we plot 413 days from the all-time high back in December of 2017, we see the week of January 28th, 2019. Another correlation between these red highlighted zones is something very, very Gann-ish: the dates. The date of the peak on the first red box is the week of December 2nd. And the peak of 2017 at the all-time high was the week of December 11th. We can also see that the period of the rise in the green boxes both happen during the beginning weeks of October (October 17th and October 26th, respectively). Gann wrote a lot about the importance of anniversary dates and to watch and record those dates because instruments will frequently find major highs and lows around those dates. We can see evidence of that on Bitcoin's chart above.
Volume
I also want to call your attention to the behavior of the participants which is reflected in the volume . We can see that the massive spikes and rises in volume appear near the peaks of the two red boxes, followed by a tapering off of volume until it comes back. Just this week (February 22nd, 2019), the highest volume in cryptocurrencies since the all-time highs (nearly equal) has come into this market. We can also see the conditions of the RSI on the weekly chart showing the extreme bottoming levels that form before the next rise. The current price conditions are certainly within the same kind of conditions we saw at the end of the November 2013 - January 2015 bear move.
Elliot Wave
There are a number of theories in Technical Analysis that are not all agreed upon by every analyst. Elliot Wave is one of those theories. Many adherents to Elliot Wave have a nearly dogmatic approach to the theory. I am not a big practitioner of Elliot Wave nor am I big advocate for its broad theory. Elliot Wave tells me one thing that I need to know and it is sufficient for my own trading: markets move in waves of at least 3 waves. On the chart above, I have laid out the first 4 waves of a longer cycle (I am not about to label it a grand or super-whatever-cycle, this will bring out the Ellioticians en mass). The inner impulse and corrective waves are also labeled and inside their respective color boxes. Essentially, we are observing the beginning of the final 5th wave of this current cycle.
What does this all mean?
For the tl:dr synopsis it means this:
Most likely we will hover the year at around current price levels.
I completely agree that now is an ideal timing to buy Cryptos. Not financial advice though.
This post was resteemed by @steemvote and received a 99.65% Upvote. Send 0.5 SBD or STEEM to @steemvote
700 days of upward action sounds so good. And I agree, this is probably the bottom.
and as for becoming a millionaire ...
IBM Blockchain President: “I See Bitcoin at a Million Dollars Someday”
https://steemit.com/bitcoin/@aferrell/ibm-blockchain-president-i-see-bitcoin-at-a-million-dollars-someday
Love it - there's quite a few folks saying it'll be in those 7 figure ranges now.
Elliot wave plus fibonacci.
There is harmonious mathematics at work in all of nature and it’s extensions - financial markets no exception... :-)
nice to have another perspective on the numbers of days for the cycles, maybe the pattern will repeat again.
————
🚀 🌕
Moon your steem everyday ! Instant Dividend payout after every game - FREE 1000 steemie first 50 players moonSTEEM.com
I want to be optimistic but I can't see BTC to start a great bull run now. But I really do hope that they will recover fast and stronger. best of luck! :D
This is the type of analysis that I like to see, and I completely loved and agree with your explanation. The markets (especially the charts) don't lie.
To me this is a priceless post, I´m saving it with me for the next few years!
(Obviously had to re-steem it).
Thank you very much! Really, I do do thank you for your comments! And I am very much looking forward to a continuing rise in value here over the next couple years. Hell, it could be a shorter wait time due to volume of participants and increase in professional capital.
I sure hope you're right! I wouldn't mind another boom...
excellent post @captainquenta