Zilliqa Price Analysis - All Eyes on a Token Migration by Josh Olszewicz
The ZIL mainnet launched in 2019 with an ERC-20 migration to a native blockchain in the near future. The crypto asset is currently ranked 37th on Brave New Coin's market cap table, at US$141.29 million, with US$5.4 million traded in the past 24 hours.

Source: https://zilliqa.com/
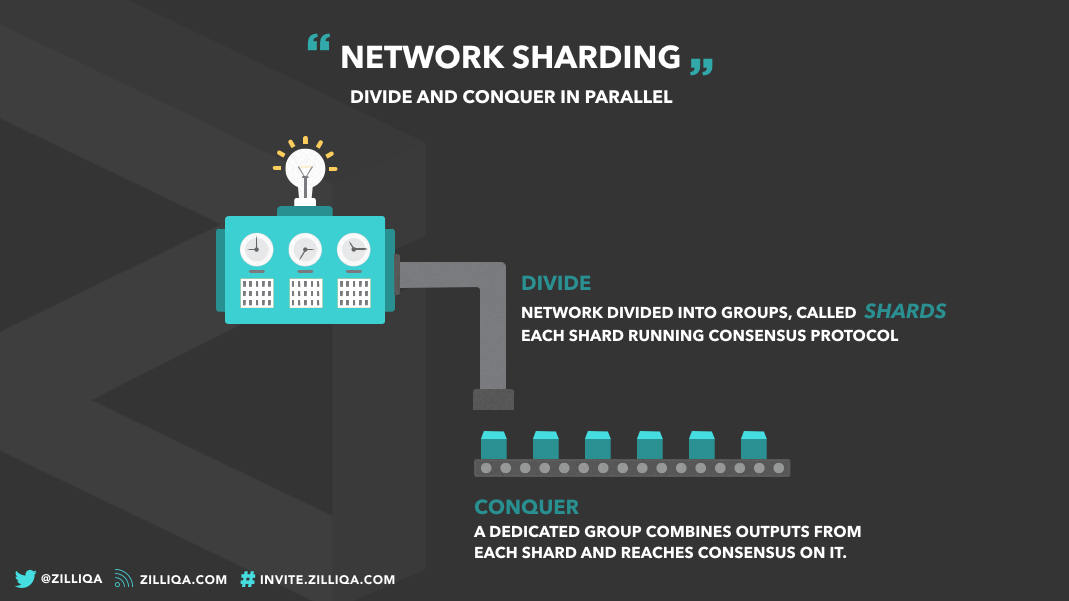
The ZIL team consists of computer scientists from around the world and is led by Xinshu Dong who holds a PhD in computer science from the University of Singapore. Since 2015, the ZIL team has been researching and releasing papers focused on blockchain scalability using Sharding, or database partitioning. ZIL achieves consensus using Practical Byzantine Fault Tolerance (pBFT) and uses Proof of Work (PoW) to establish identities and perform Sharding. This hybrid mechanism prevents Sybil attacks, or ballot stuffing, when nodes are joining the network. NEO, Tendermint, and Hyperledger also all use variants of Byzantine Fault Tolerance. For smart contracts, the blockchain will use the native Scilla programming language.
Source: https://blog.zilliqa.com/https-blog-zilliqa-com-the-zilliqa-design-story-piece-by-piece-part1-d9cb32ea1e65
The pBFT algorithm is designed to mitigate bad actors or node failures in asynchronous systems. All the nodes in the network are ordered in a sequence with one node being the leader and the honest nodes come to an agreement on consensus. The last step of the protocol requires nodes in the network to sign that they have all seen and agreed on the block. Similar to the 51% attack vector for PoW consensus, pBFT assumes that malicious nodes do not equal or exceed 33% of all the nodes during a given time period. pBFT consensus also allows for less energy-consuming consensus than PoW.

Source: https://www.altoros.com/blog/hyperledger-fabric-chaincode-practical-byzantine-fault-tolerance-and-v1-0/
PoW on ZIL will be performed using the Ethash algorithm at the beginning of every 100 blocks. ZIL's mining network is further divided into several smaller networks referred to as a Shard. A miner is assigned to a Shard by a set of miners called Data Shard (DS) nodes. With PoW coins, every node works on the same block, but in a Sharded setting, only a subset of the network works on the same block.

Source: https://github.com/Zilliqa/Zilliqa/wiki/Mining
Mining rewards will be split into base rewards (25%) and flexible rewards (70%). Base rewards are distributed to all validating nodes in the network. Flexible rewards are based on the amount of valid and accepted (first 2/3 signers within a shard) signatures submitted by a node while performing pBFT consensus. The last 5% of rewards are given to the lookup and seed nodes.
The ZIL ICO raised US$22 million from December 27th, 2017 to January 4th, 2018 at a token price of US$0.00381 per ZIL. The network has a finite supply of 21 billion tokens, of which 60% were in existence at the Token Generation Event (TGE) and 40% will be released gradually over time through mining rewards. A maximum of 30% of the tokens were distributed during the ICO with no lockup or vesting. The remaining 30% of the tokens will be vested quarterly over the next three years at various allotments; 12% to research, development, community engagement, bounty programs and marketing, 10% to Anquan Capital, 5% to the ZIL team, and 3% to agencies & advisors. The Bitcoin Suisse advisor allocation was unvested.
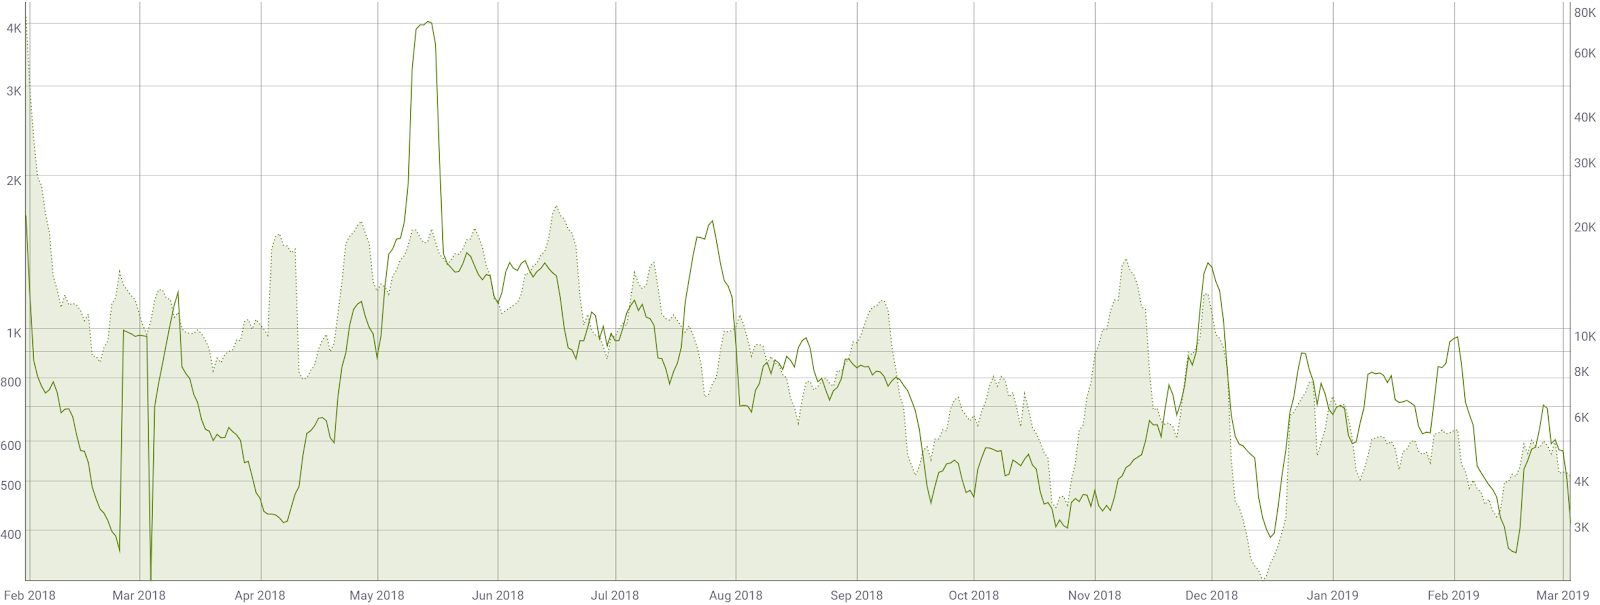
Although there are no statistics for the ZIL blockchain, the ZIL ERC-20 token can be tracked. The transaction count per day (line, chart below) for the token is currently 413 and has declined significantly since just after the conclusion of the ICO in February 2018. The average transaction value (fill, chart below) is currently US$4,000 and peaked around US$73,500 in May 2018. This peak also corresponds with an ATH in price.
Source: coinmetrics.io
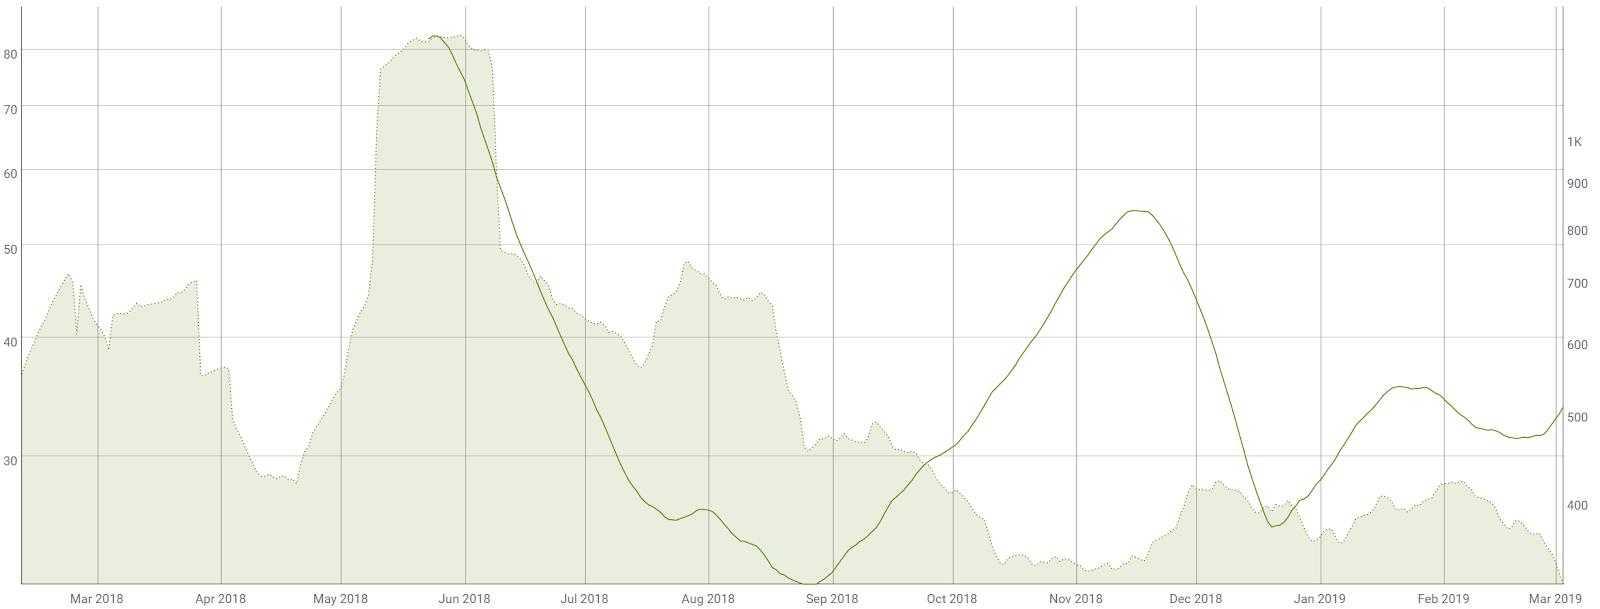
The 30-day Kalichkin network value to estimated on-chain daily transactions (NVT) ratio (line, chart below) has been ranging between 30 and 35 since December. The NVT during the ATH exceeded 80. A clear downtrend in NVT suggests a coin is undervalued based on its economic activity and utility, which should be seen as a bullish price indicator, whereas an uptrend in NVT suggests the opposite. Further, the NVT data for ZIL will not be valid until the mainnet is fully live.
Daily active addresses (DAA) are currently just above 300 and near an all-time low. DAA were the highest during the May ATH. DAA are important to consider when determining the fundamental value of the network based on Metcalfe's law. Other grassroots metrics include 27,000 Telegram participants and 10,000 Reddit subscribers.
Source: coinmetrics.io
Turning to developer activity, ZIL has 16 repos on GitHub with the main repo accruing 4,709 commits over the past year (shown below). Most coins use this development platform, where files are saved in folders called "repositories," or "repos," and changes to these files are recorded with "commits," which save a record of what changes were made, when, and by who. Although commits represent quantity and not necessarily quality, a higher number of commits can signify higher dev activity and interest.

Source: https://github.com/Zilliqa/Zilliqa/graphs/contributors
ZIL exchange-traded volume has been led by the Bitcoin (BTC) pair over the past 24 hours with Binance alone accounting for over 40% of all combined volume. ZIL was added to several exchanges throughout 2018; Huobi in January, Binance in March, Bithumb in May, Bitfinex in July, Bittrex in November, and Coinbase in December.

Google Trends data for the term "Zilliqa" trended down throughout most of 2018, with peaks in January and May 2018. These spikes also correlate with local highs in price. Searches spiked recently in December and January, likely related to the Coinbase Pro addition and mainnet launch. A 2015 study found a strong correlation between the Google Trends data and BTC price, while a May 2017 study concluded that when the U.S. Google "bitcoin" searches increased dramatically, BTC price dropped.

Technical Analysis
ZIL has been hit heavily by the 2018 bear market, like most other coins. As the potential for the end of the bear trend approaches, exponential moving averages (EMAs), volume, Pitchforks, and Ichimoku Cloud can be used to find optimal entry and exits. Further background information on the technical analysis discussed below can be found here.
On the daily chart, the 50/200EMA cross is currently bearish with price far below the 200EMA and no touches of the 200EMA for most of 2018. For this reason, a mean reversion attempt to the 200EMA, currently at US$0.031, is likely. The volume profile (horizontal bars) also suggests a resistance zone at this level. A clean break of the horizontal resistance at US$0.025 will likely confirm the move higher. The next conservative bullish long entry signal will occur with a bullish 50/200EMA cross. There is a subtle bullish divergence as price made a lower low but did not make a lower low on RSI, suggesting weakening bearish momentum.

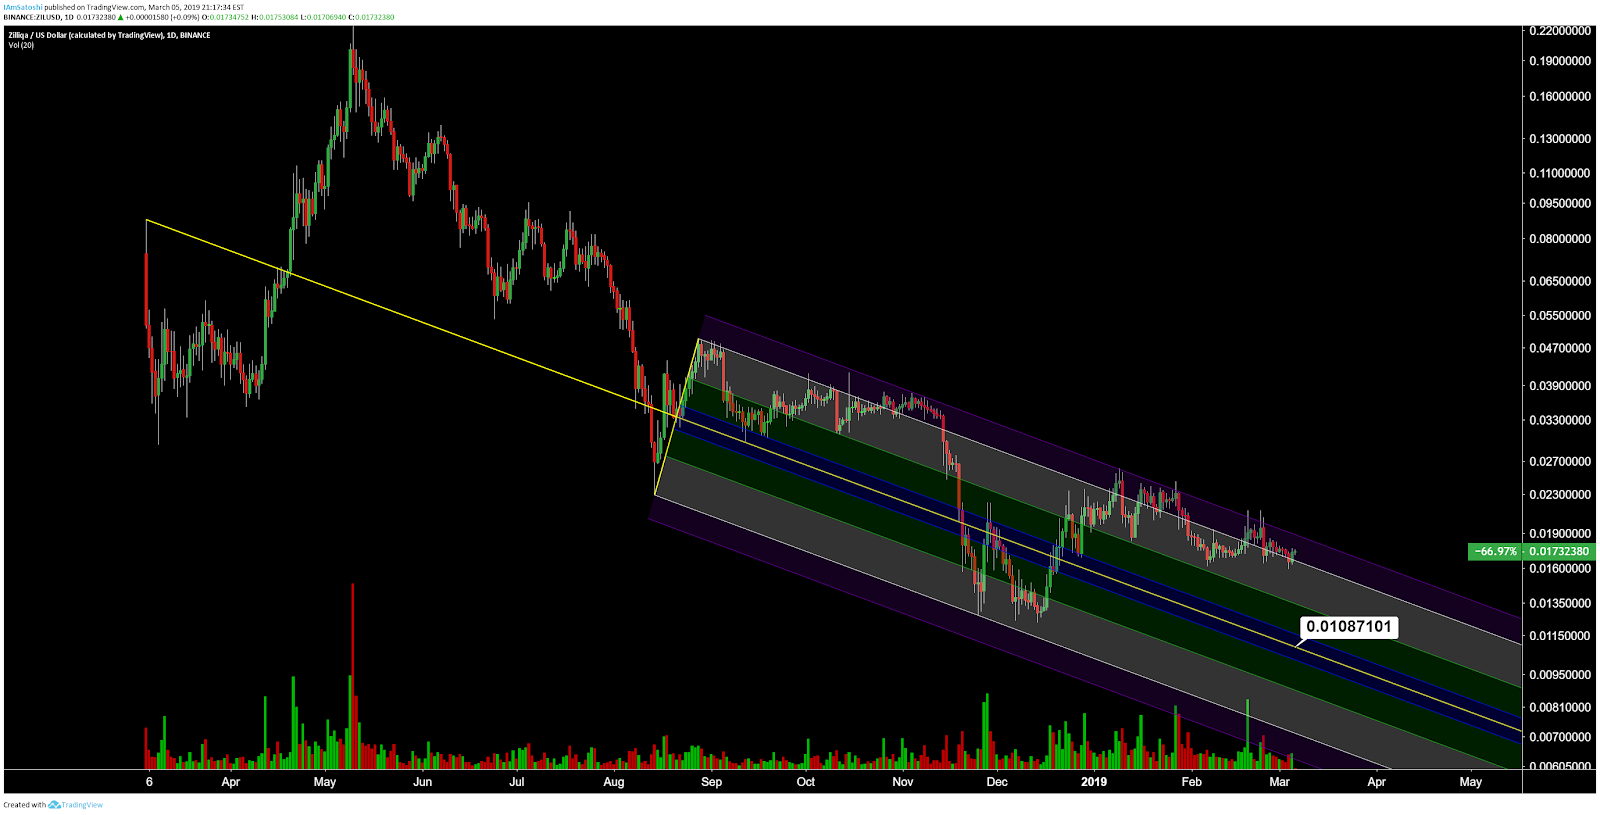
Price has been confined within a bearish Pitchfork with anchor points in March and August 2018. Historically, price currently sits in heavy diagonal resistance. As price attempts to breach the top resistance zone, a bullish invalidation attempt is possible. However, if this attempt fails, a move toward the median line (yellow) at US$0.0108 becomes extremely likely. Price has not returned to the median line since mid-December.
Turning to the Ichimoku Cloud, four metrics are used to determine if a trend exists; the current price in relation to the Cloud, the color of the Cloud (red for bearish, green for bullish), the Tenkan (T) and Kijun (K) cross, and the Lagging Span. The best entry always occurs when most of the signals flip from bearish to bullish, or vice versa.
The status of the current Cloud metrics on the daily time frame with doubled settings (20/60/120/30), for more accurate signals, are bearish; price is below Cloud, the Cloud is bearish, the TK cross is bearish, and the Lagging Span is below Cloud and in price. A traditional long entry signal will not occur until price is above Cloud. The long flat Kumo tops at US$0.025, US$0.027, and US$0.03 all represent horizontal resistance.

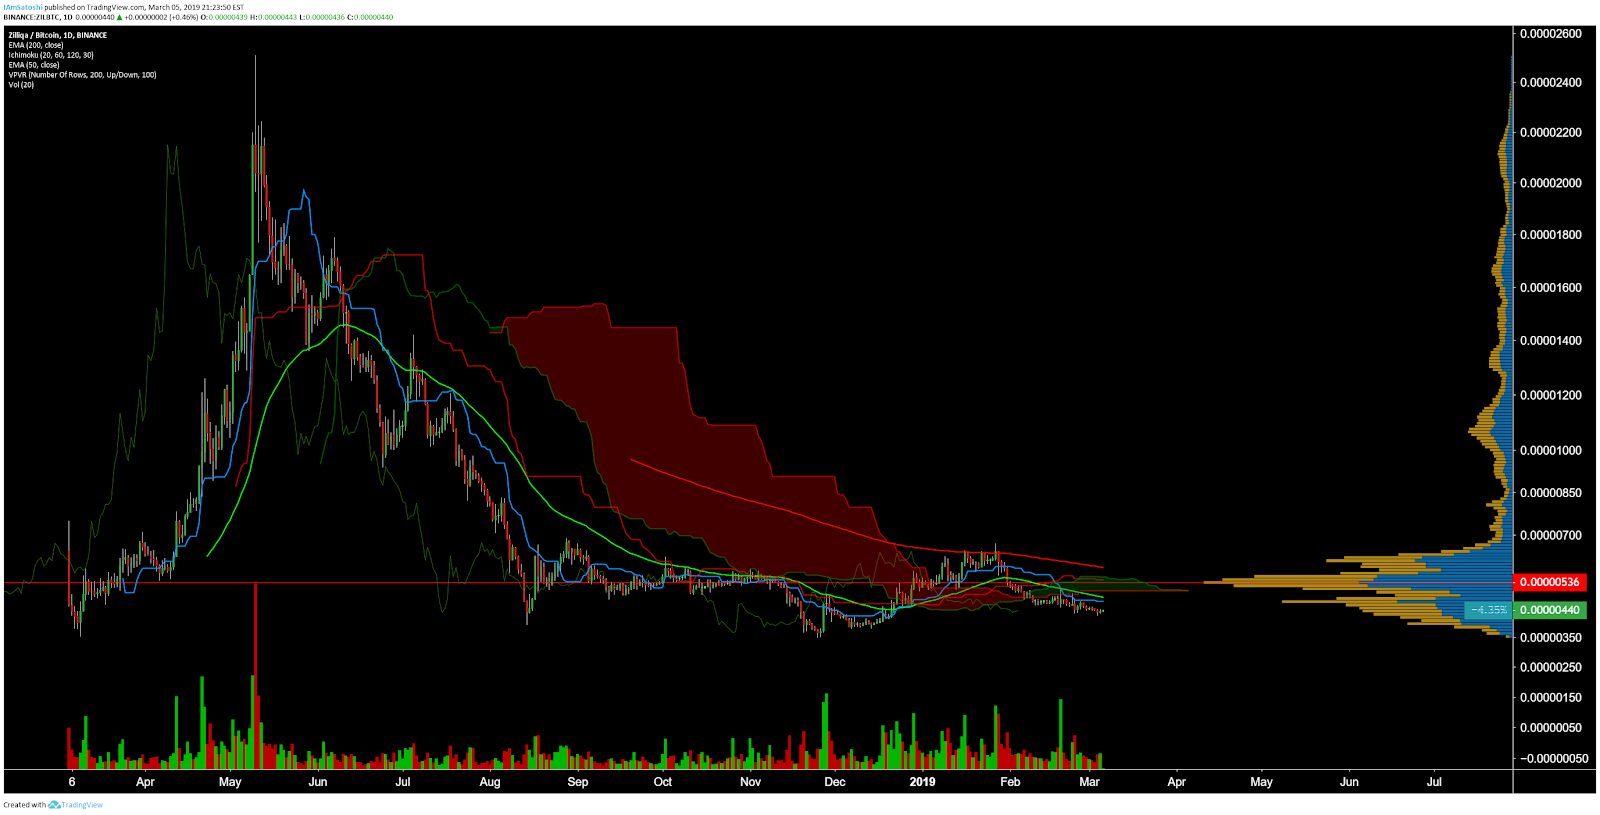
Lastly, on the ZIL/BTC pair, the daily chart also shows a bearish trend, with a rejection of the 200EMA and bearish Cloud metrics. The most conservative long entry would not occur until price is above both the 200EMA and the Cloud, while the most aggressive long entry would set bids near the all-time low around 346 sats. ZIL/BTC has ranged between 346 and 680 sats for most of the trading history. Any breach of either horizontal levels would likely bring further bullish or bearish momentum.
Conclusion
ZIL uses a unique hybrid pBFT/PoW protocol mechanism which has a live mainnet but has not completed an ERC-20 token migration to the native blockchain. For this reason, most network metrics are currently unavailable or do not portray the true measure of a fully-fledged network. Although aiming to have excellent scaling capabilities and high transaction throughput, this has yet to be seen on mainnet. This year, ZIL will join a crowded field of competing smart contract platforms, most of which have no Dapp market share compared to ETH, EOS, and TRX. The true test of the longevity of any blockchain is three-fold; can it maintain reliable consensus, can it scale, and can it remain decentralized.
Technicals are limited to almost exactly one year of data from Binance. Many other alt-coins on Binance are currently experiencing heavy bullish momentum but ZIL is not. The ERC-20 token migration may be the speculative catalyst needed to pull price above the 680 sat resistance on the ZIL/BTC pair, but the trend currently remains bearish.