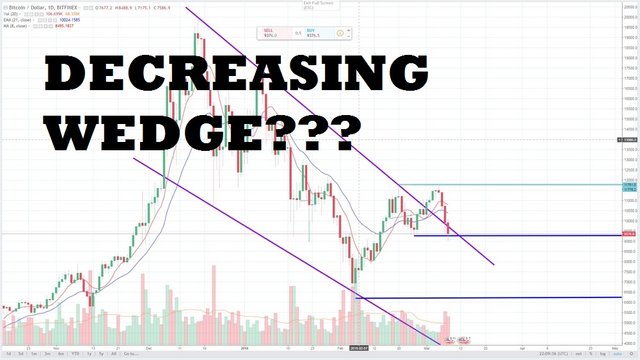
Trying to learn how to read cryptocurrency charts/graphs ... decreasing wedge on the daily chart???
Hello Steemians

DISCLAIMER
Before I go on with the journey, just want to include a Disclaimer. I am not a financial advisor and hence please do not take any part of this post as financial advice. I created this post because I am interested in cryptocurrency and technical analysis and want to learn more about it. Please perform your own due diligence.
OVERVIEW

WHAT DO I SEE ON THE DAILY CHART
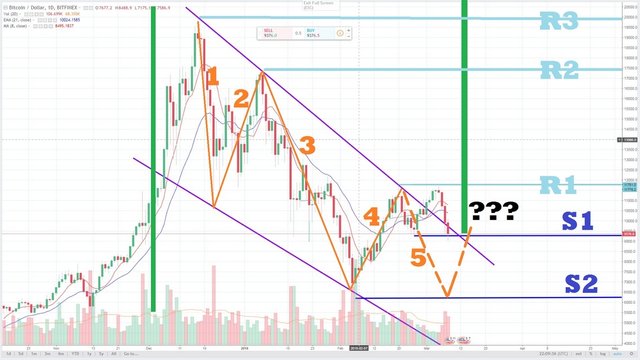
In this case the following can be observed:
- An 'decreasing wedge' is happening on the daily chart
- The wedge is in the process of completing it's 5th wave.
- If price breaks through the 1st Support line (labelled S1), then price may continue to decrease, and hit support line 2 (labelled S2).
- There is a possibility that the 5th wave is truncated, and so it is likely that it will bounce off S2. That means, that there is a possibility that price may keep on falling until S2.
- If price breaks S2, then it may go further down until the support line of the 'decreasing wedge'...
However, when the 5th wave is complete, one should now pay close attention to 4 hour chart to see if a reversal pattern can be spotted.
- When the price does break out the resistance of the 'decreasing wedge', there is a chance for a bullish movement...
- At that time, one can switch to hourly chart to check which is the appropriate opportunity to enter...
Let me know what you think.