A Technical Look At Populous - PPT
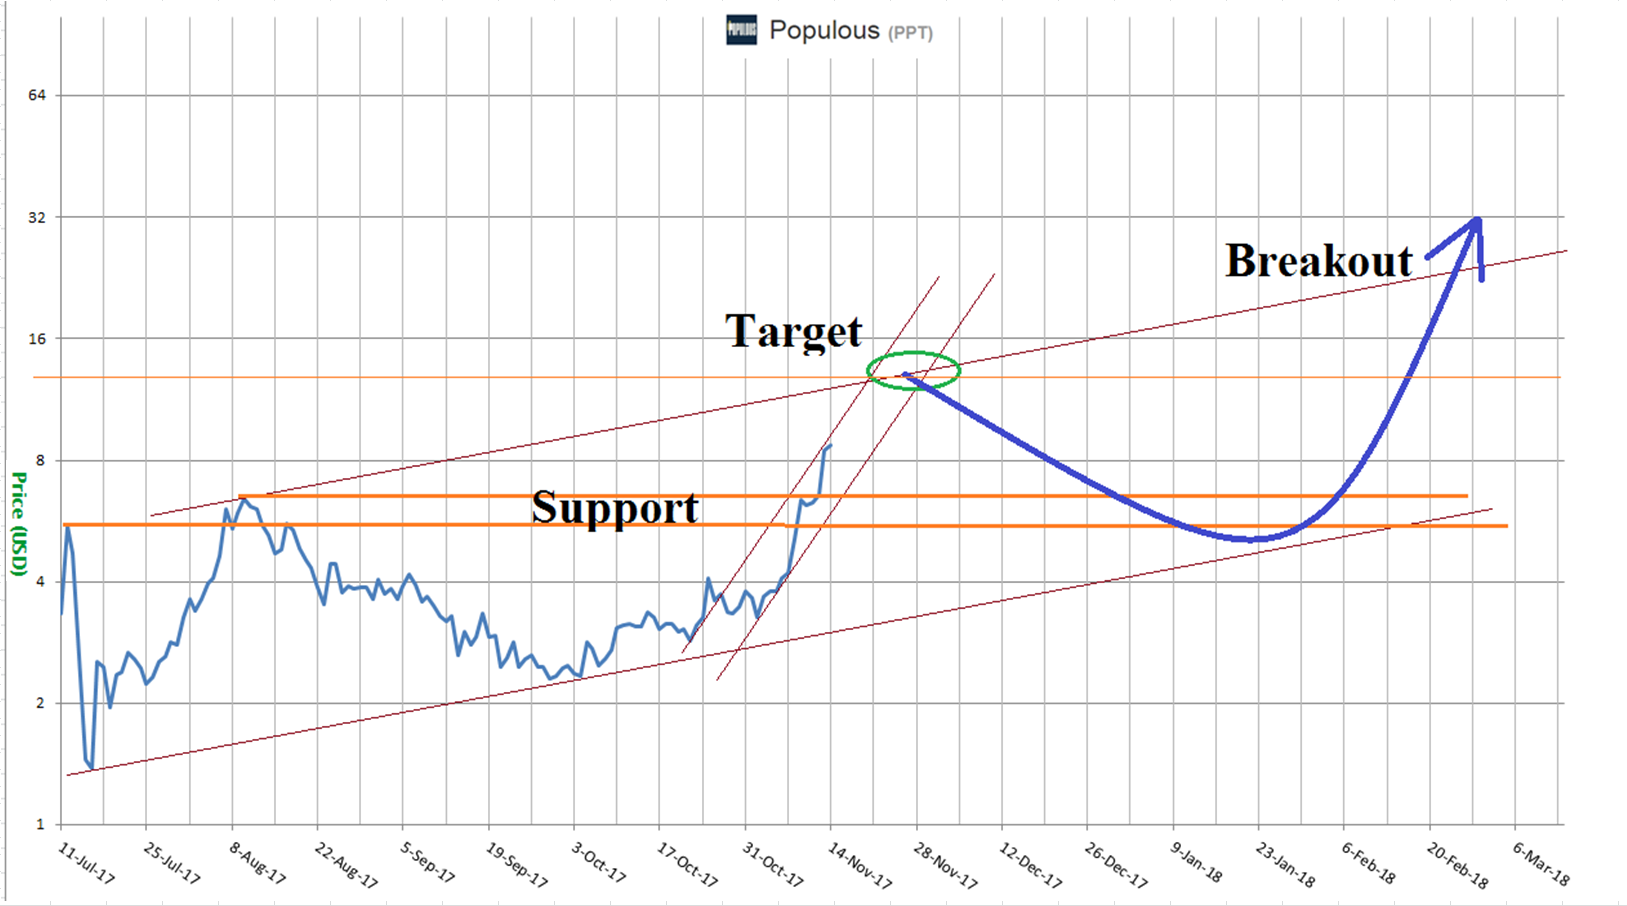
Yesterday I did a fundamental take on Populous - PPT - Let's look at a probable outcome into next year. Below is a logarithmic chart(A type of scale used on a chart that is plotted in such a way that two equivalent percent changes are represented by the same vertical distance on the scale, regardless of what the price of the asset is when the change occurs).
The target area is a point of probable congestion, the price could break it but odds are against it. The price just recently broke the previous top which is now support. The price will need to tag the area that was resistance (now support) to provide the fuel to break the ascending channel.
Another alternative (not shown) a flat consolidation leading into Q1 and the breaking out from there.
Anyway .......... we'll have to see what unfolds. Really anything could happen.
All data and information provided is for informational purposes only. Trend Wizard makes no representations as to accuracy, completeness, currentness, suitability, or validity of any information in this post and will not be liable for any errors, omissions, or delays in this information or any losses, injuries, or damages arising from its display or use. All information is provided on an as-is basis.