The dashboard that shows the status of bitcoin miners!
The Bitcoin mining dashboard gives information and signals about bitcoin miners.
This dashboard shows several indicators and data on bitcoin miners, such as:
Revenue\sCosts
Selling pressure Flows
Our objective is to aggregate all on-chain information in order to assess the financial health of bitcoin miners (revenue and expenses), as well as their behavior (what their bitcoin flows might tell us about what they are doing).
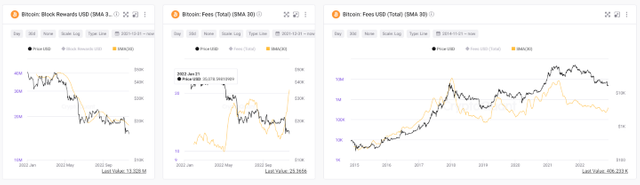
We can get information about bitcoin's prospective selling pressure, its value, and the market's overall cycle from miners. The block subsidy, which is the freshly created bitcoin awarded to the miner who successfully solved the proof-of-work problem, and the fees users pay to have their transactions included in a block are the
two sources of income for bitcoin miners. So, by examining block fees and rewards, we can determine how the miners and the Bitcoin network are performing.
When there is a lot of activity on a network (i.e., there are plenty of transactions that need to be completed), costs typically rise or, in some cases, even sharply increase. This rise or spike may indicate future market cycle patterns.
Mining Difficulty
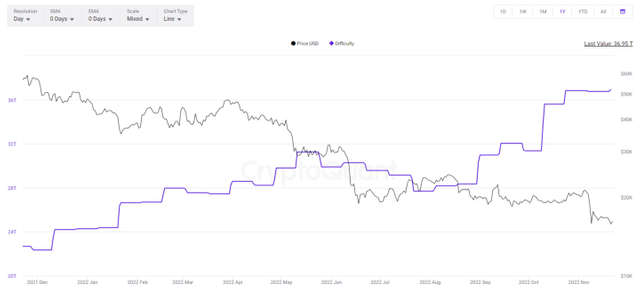
The difficulty of mining is one of the most important elements that affects how much it costs to mine bitcoin, along with the price of power. Existing Bitcoin miners will have to spend more for resources to produce the same amount of bitcoin due to the increased difficulty. The mining difficulty and hashrate are correlated. The hashrate, or the proportion of miners contributing to the network, determines how difficult it is to mine, and vice versa.
Every 2016 block, or about every two weeks, the mining difficulty is changed either higher or lower. This is done to keep the block interval at a consistent 10 minute average. These indicators provide a summary of the various tasks performed by miners. This allows us to calculate the value of bitcoin and how risky it is for miners to sell BTC at the top or bottom of the market.
The Index of Miners' Position (MPI)
The Miners' Position Index statistic contrasts the volume of Bitcoin (BTC) mined during the previous year with its yearly moving average. A spike in the MPI during a bear market indicates that miners have given up and are losing money when they sell their bitcoin. Typically, this takes place during market peaks, just before price corrections, or if miners move more of their coins than normal. An MPI rise during bull markets shows that Bitcoin miners are purchasing it.
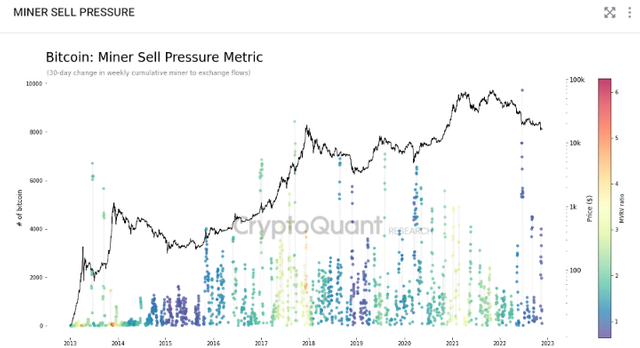
This function calculates the weekly average of the total amount of bitcoin that moves from miners to exchanges over the course of 30 days. This metric measures the amount of selling pressure miners are exerting on BTC, which frequently happens at market peaks, just before price corrections, or as a sign of miner capitulation (miners selling their BTC at a loss) in unstable markets when the price of Bitcoin is declining.
A higher value indicates that more bitcoin is being deposited into exchanges by miners.