Technical analysis, Indicators and Patterns explainend! Lesson 1 #Bartcardi
What is a Technical analysis
Technical analysis is a trading tool employed to evaluate security's and attempt to forecast their future movement by analyzing statistics gathered from trading activity, such as price movement and volume. Technical analysts focus on charts of price movement and various analytical tools to evaluate a security's strength or weakness and forecast future price changes.
What are Indicators
Indicators are statistics used to measure current conditions as well as to forecast financial or economic trends. Economic indicators are statistical metrics used to measure the growth or contraction of the economy as a whole or sectors within the economy. Technical indicators are used extensively in technical analysis to predict changes in stock trends or price patterns in any traded asset.
Different kind of charts
There are a couple different kind of charts. They all represent different information so its important to know which charts are usefull. Its also personal prefference which chart you youse. Personally i just love the candle sticks, but maybe its different for you.
The different charts:
- Line charts: Only show the closing price over a set period. More info
- Candlestick charts: This shows the opening and closing price over a set period. It also shows what the absolute high and low was of a candle in that period (recommended). More info
- Point and figure charts: This charts shows price movement without showing time or volume (not recommeded). More info
- Bar charts: Very similar to candlestick charts just what you personally like. More info
Different kind of patterns
If you know where to look you can see different kind of paterns in charts. These charts happen again and again so history keeps repeating itself. This way by studying these paterns you have a huge advantage. These don't happen 100% of the time, because this way everyone would be rich. Its more of an art then a science. The basic of patterns are a reversal and continuation. A reversal is when the direction of a chart changes and a continuation is when it just keeps going the same direction.
Patterns i will cover here:
- Head and shoulders
- Cup and handle
- Double tops and bottoms
- Triangles
- Gaps
Patterns Explained
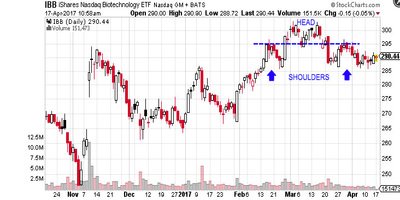
- Head and shoulders: In head and shoulders you are looking for three peaks with the middle peak being the highest one. The 2 other peaks being on the same level and lower then the highest peak. You connect these with a trendline this way you know the basic support level. Head and shoulders is a reversal chart pattern so you look for the breakdown.
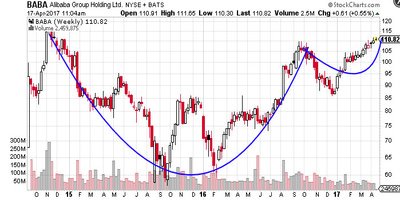
- Cup and handle: This is a continuation pattern of a bullish trend. Afther a small pause of the of the bullish pattern it will go back up in a U shape. Trying to explain it as simple as possible.
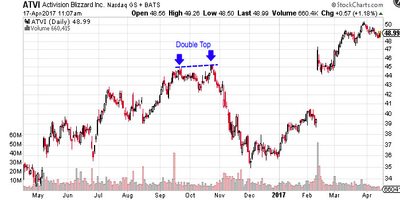
- Double tops and bottoms: This pattern is know to be very easy and reliable. If you see twice a top or bottom hitting the same resistance or support level without a breakout. This now signals a reversal of the trend.
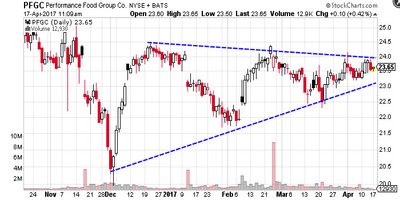
- Triangles: Triangles happen very offten but there are a bunch of different triangles you can look for. I'm going to point out which triangles there are. There are symmetrical triangles, ascending triangles and descending triangles. Symmetrical triangles occur when two trend lines converge toward each other and signal only that a breakout is likely to occur – not the direction. Ascending triangles are characterized by a flat upper trend line and a rising lower trend line and suggest a breakout higher is likely, while descending triangles have a flat lower trend line and a descending upper trend line that suggests a breakdown is likely to occur.
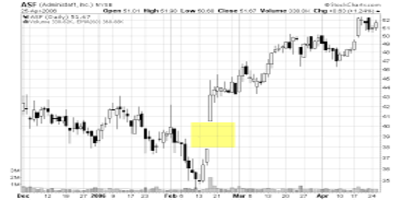
- Gap: Sometimes you see a gap in a chart. This is because when the market closes at a certain price and it opens back up at another price. This way their will be a gap in the chart. As example it closes a $4.00 but opens back up at $6.00 you will have a gap.
- Breakaway gap: This happens when a trend is starting to form.
- Runaway gap: This happens in the middle of a trend.
- Exhaustion gap: This happens at the end of a trend.
Different kind of indicators
I already explained what a indicator is earlier in the article, but lets dive deeper into this. I will explain my personal favourite indicators and how to use them. If you want to understand all the indicators you will need about 1 or 2 months (Or longer), because their are alot. What is important to know is that there are leading indicators they can be helpfull to predict where the price is going. Also there are lagging indicators these will help traders understand how strong a trend is.
Indicators
- MacD (Moving avergae convergence divergence)
- RSI (Relative strength index)
- CCI (Commodity channel index)
- Moving Average
- ADI ( Average Directional Index)
If you know the abbreviations you should be good.
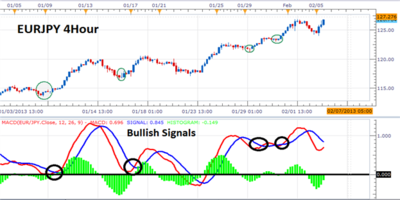
- Macd: This indicator is helpfull to know if you are in bullish territory or in bearisch terrtory. If you look at the bottom of the picture above you can see a blue and a red line. If the red line is above the blue line this means its bullish territory and the other way around. So you have to be on the look out for those cross over, because then a trend might reverse.
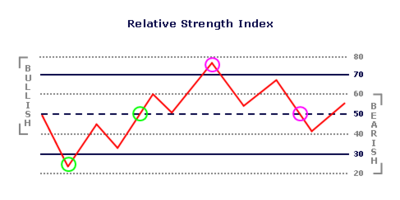
- RSI: This indicator will help you determine when to sell and when to buy. If you look at the chart above you will see lines on the 30 and 70. If the RSI is inbetween this i don't pay alot of attention to it. Only when the RSI is above 70 it shows that something is really overbought so you should sell. And when the RSI is underneath 30 something is really oversold so you should buy.
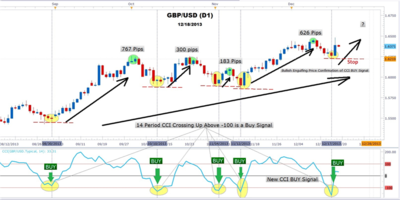
- CCI: This indicator is similar to the purpose of the RSI. You can see in the picture below if the CCI drops you buy if it goes up you sell. You can use both the RSI and CCI together for comformation of the trade.If they both show the same thing there is a better change it will happen. Simple logic.
- Moving average: This is really well explained in the video above. I suggest you check that out. Moving average just smooths out the price action. Simple as that but really helpfull.
- ADI: With this indicator you can see how strong a trend is. So if there is an uptrend and the ADI is at 50 you know this is a strong trend and has a big change to keep that trend going. And if there is an uptrend and the ADI is at 10 you know this is a weak trend. This will probably reverse.
Conclusion
I hope you learned something from this article. The conclusion is the more you learn about this the greater your changes of making money. This is just to get you started and my knowelgde. But there is alot that i don't know. This is because i am still learning and i would love some help with that. If i made any mistakes you can always point that out in the comments. If i didn't u can also point that out.
Alot of information i got is from investopdia. So i highly recommend u check that site out if your interested in this.
Disclaimer: Most these pictures aren't from me
Author: #Bartcardi
if u need any help with it or if you have a good question or business proposal for me. Find me on discord under the name Bartcardi
A follow, comment, upvote and resteem rare highly appreciated!
My account is still pretty small so i can use all the support i can get!
Check out my next post: https://steemit.com/money/@bartcardi/technical-analysis-and-on-steem-for-the-long-run-pricepredcition-bartcardi (TA on steem)

you should run a chart on steem and sbd price, thanks for this article its enlightening ill share with my noob friends so they could learn from this aswell, analyzing price charts and understanding trading terms can be rather daunting, especially for the beginners but you made it so simple thank u.
Great tutorial! Easy to understand and practical. I try to share my knowledge and learn at the same time. I do Elliott waves and chart pattern analysis. I've made several analyses on both Steem and SBD that you should check out. Also just posted a new gem about Golem.
GOLEM (GNT) - Analysis (572% POTENTIAL PROFIT) https://steemit.com/cryptocurrency/@benkalashnikov/golem-gnt-analysis-572-potential-profit
https://steemit.com/money/@bartcardi/technical-analysis-and-on-steem-for-the-long-run-pricepredcition-bartcardi Made a simple and easy steem TA!
Upvote nd follow me
Upvote nd follow me
Thankyou very much and do a TA on steem and sbd u mean?
That would be great!
Just made one mate
yes definitely
yes of course
wow..this is my first time here..how do this stuff run
Just made one mate!
me also first experience
True
https://steemit.com/steemit/@noganoo/all-of-the-top-ranked-users-claiming-to-care-about-the-steemit-are-the-same-ones-who-allowed-the-platform-to-be-abused-early-on
Simplest explaination I have found yet, and on Steemit none the less.
i also found this is great and i feel happy about this
awesome post my steemit friend good wish you good luk thank you very much
It's all nice, but technical is not enough
yes but we found nice
@dreamchasser would you mind taking a look at any of my post and telling e what I need to improve on to make a living from Steemit?
true absolutely
Thanks for the info 🙏.Aprreciate the lesson
good one..,
Excellent article. Very interesting to read. I really love to read such a nice article. Thanks! keep rocking.
thank u.
Agree the explanation really helped me understand the jargon thrown around. Video confused me a bit, though.
Can you suggest any software we can use to chart these things on our own?
@dreamchasser @bartcardi
That's a good post with all the essential tools to understand a graphic but.. on this world, I mean.. in crypto is much, much, much important to know where and why are you investing on the selected project.
TA stays in a second layer after the first research about project is done. When we decided that the project is good and it has potential then.. it's time to look at the graphic, no before!
This crypto world it's a bit different from stocks and we are just at the beginning of this amazing technology birth and few data we have from the past to make a right TA for the long run.
We are all lucky to be here!! :)
(resteemit)
Good to point that out the fundamentals are ofcourse the first thing to look for. I will only do a TA if the fundamentals are there. Great comment!
I also see SMTs as the solution to the low earning woes on Steemit, because with multiple platforms distributing their own tokens, it will give people a variety of options to increase their overall earnings
yes..
Technical Analysis seems like voodoo to me. I know, it's more of an art than a science. Put the same paintbrush in my hands and in Van Gogh's hands and you'll come up with two entirely different results.
Hahahah nice comparison. But yea thats true you have to know what you see. Everything i learn i will share with the steemit community! So u might become that van Gogh because of me ;P
STEEM WILL MOON!
Whoever said TA doesn't work should start charting ;)
yes you are right
Well, my money is definitely on it mooning!
hmmmm
hahaha top comment STEEM WILL MOON!
Lets hope so my friend Lets hope so
🚀
Genius or crazy “steem will moon” top comment?
how much it harm the site we need to have a look on this
https://steemit.com/blog/@farazahmad/reality-of-sweetsssj-she-is-doing-fraud-part-2
I need whale support against this scam
what does it means??
Steem price will go very very very high, to the moon
OOF OOF OOF. Prrroooovvveeee it boyo
I agree with you :)
This article and this: https://steemit.com/cryptocurrency/@hami/perma-crypto-culture-review-of-how-the-permaculture-design-principles-can-be-applied-to-the-crypto-world
Are invaluable resources. For newbies and people who have been in the game for a while.
Do you think we should hold LTC?
Hard to say it is a great replacment if bitcoin fails. Then LTC will have a large change to moon but will still compete with dash and BCC. And to take in cosideration that the owner of LTC sold all of his coins at $330 i wouldn't bet my money on ltc anymore
nice post ty
Important question- Have you considered a name change now that Bacardi has purchased Patron?
Bartcardion doesn't quite roll off the tongue though...
haha wasn't aware of that. Might have to change it then!
Thank you for your post it will help me to understand the crypto market
DISCLAIMER: dropahead Curation Team does not necessarily share opinions expressed in this article, but find author's effort and/or contribution deserves better reward and visibility.
to maximize your curation rewards!
with SteemConnect
12.5SP, 25SP, 50SP, 100SP, 250SP, 500SP, 1000SP
Do the above and we'll have more STEEM POWER to give YOU bigger rewards next time!
News from dropahead: How to give back to the dropahead Project in 15 seconds or less
How use it.
Hi, have you joined our discord chat server already? Please join there and send me a direct message: https://discord.io/dropahead
You have to send ME a direct message, RIGHT-Click my username, click option: "Message"
NOTE: All channels are blocked until you pass the quiz
Thanks for the breakdown! Very helpful!