Increased Accuracy During the Identification of THC and CBN using Proton Nuclear Magnetic Resonance Spectroscopy Analysis
Experiments and analyses have produced useful data for interpretation. Solutions which allow more precise identification, further benchmarking of THC and CBN containing samples.
The following are Proton Nuclear Magnetic Resonance (1H-NMR) Spectroscopy Analysis plottings from the University of Ottawa facilities. Sample analysis was performed by Glenn A. Facey, Ph.D. (Gérant du Laboratoire RMN | NMR Facility Manager)
Sample preparation, data comparison and interpretation are completed by the composer of this document, test subject and inventor of technologies Dean Piecka.
Figure 1. Proton Nuclear Magnetic Resonance Spectroscopy Analysis plotting of trichome heads isolated from stalks by application of the High-Voltage Field extraction method.
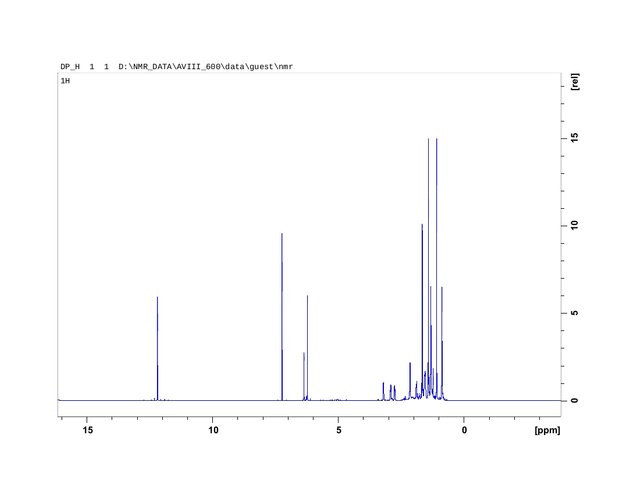
Figure 2. Proton Nuclear Magnetic Resonance Spectroscopy Analysis plotting of CBN concentrate produced from trichome heads (HVF extraction). Trichome heads applied as the source material increased isolation of oxidized hydrophillic non-psychopharmacologically active cannabinol (CBN) concentrate samples.
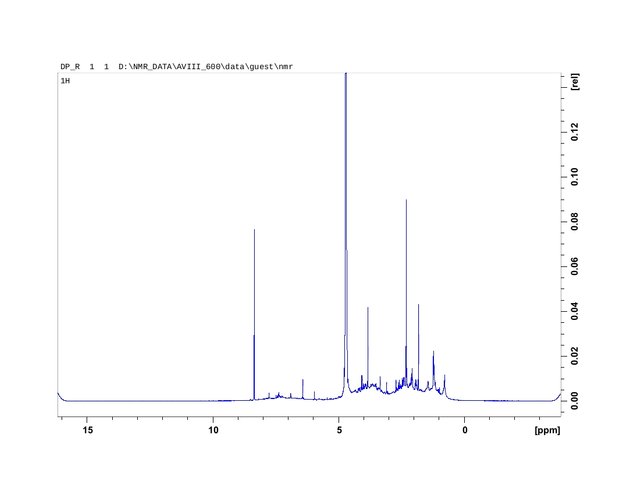
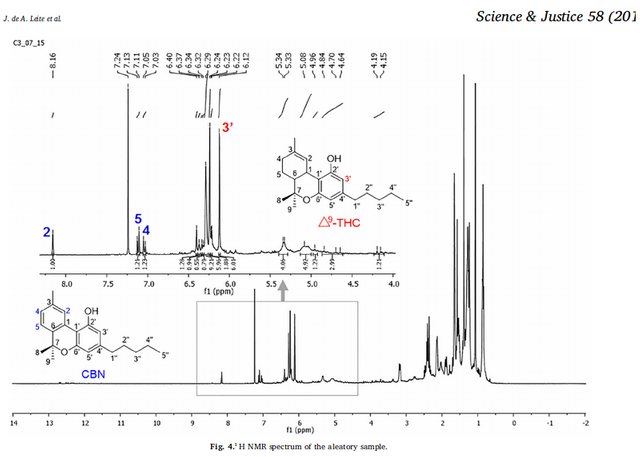
Figure 3. Comparison for differentiation of THC and CBN containing samples by their Proton Nuclear Magnetic Resonance Spectroscopy Analysis plottings.
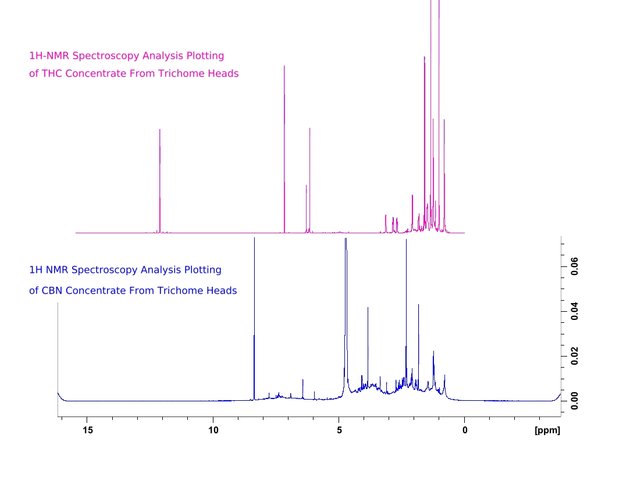
Figure 4. The identifying peaks of THC are encircled at 6.2 to 6.4 as well as the grouping between 0.9 and 1.8. Peaks which identify CBN (0.9 to 2.4) are now more accurately identified, due to the purity of trichome head source material used to further isolate samples. A plotting at 3.9 of varying intensities depending on the duration and intensities of oxidation in samples provided suggest the presence of a degradation product of CBN (Cannabinol).
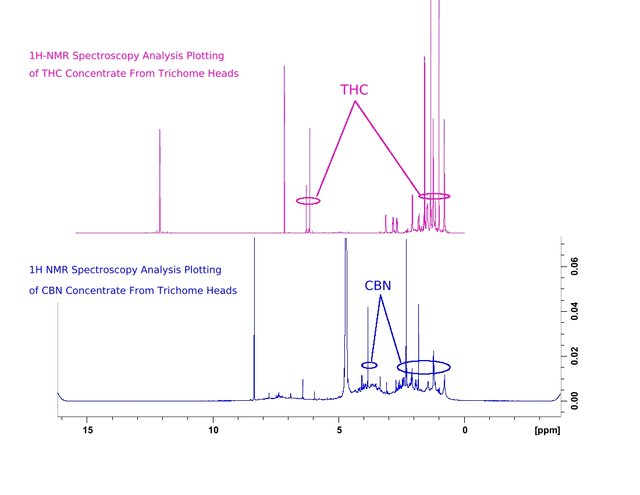
Figure 5. The superimposition of both THC and CBN Proton Nuclear Magnetic Resonance Spectroscopy Analysis plottings.
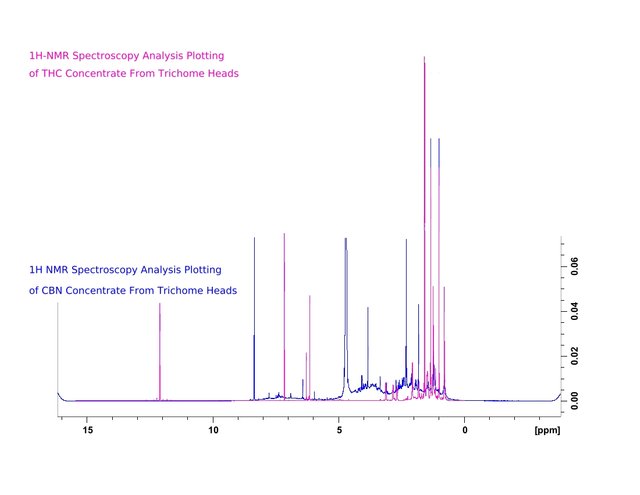
Figure 6. The superimposition of data from the previous figure has been coloured blue. This provides a composite which is very familiar to those who have analyzed cannabis samples by Proton Nuclear Magnetic Resonance Spectroscopy Analysis. Any samples which contain THC and CBN can be expected to have plottings similar to those of this composite. The issue with analysis of phyto-synthesized compounds is the difficulty in isolating them without use of destructive sample preparation and analysis methods. Gas chromatography and distillation provide data though not without causing changes in the chemical structures of compounds.
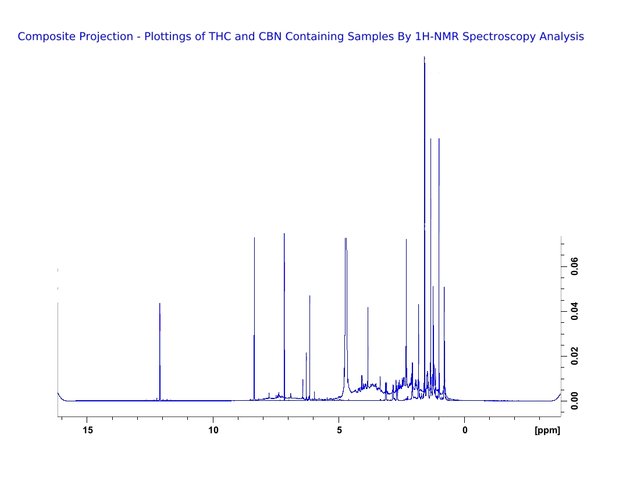
Figure 7. Does this look familiar? The combined plotting of THC and CBN was among the only publicly available data for comparison of phyto-cannabinoid samples analyzed by Proton Nuclear Magnetic Resonance Spectroscopy Analysis plotting. Now we can divide and recompose the inclusive plottings such as these from the more accurate samplings of THC and CBN from trichome heads.