BTC/USD - Buy Opportunity Day Chart bullish engulfing .
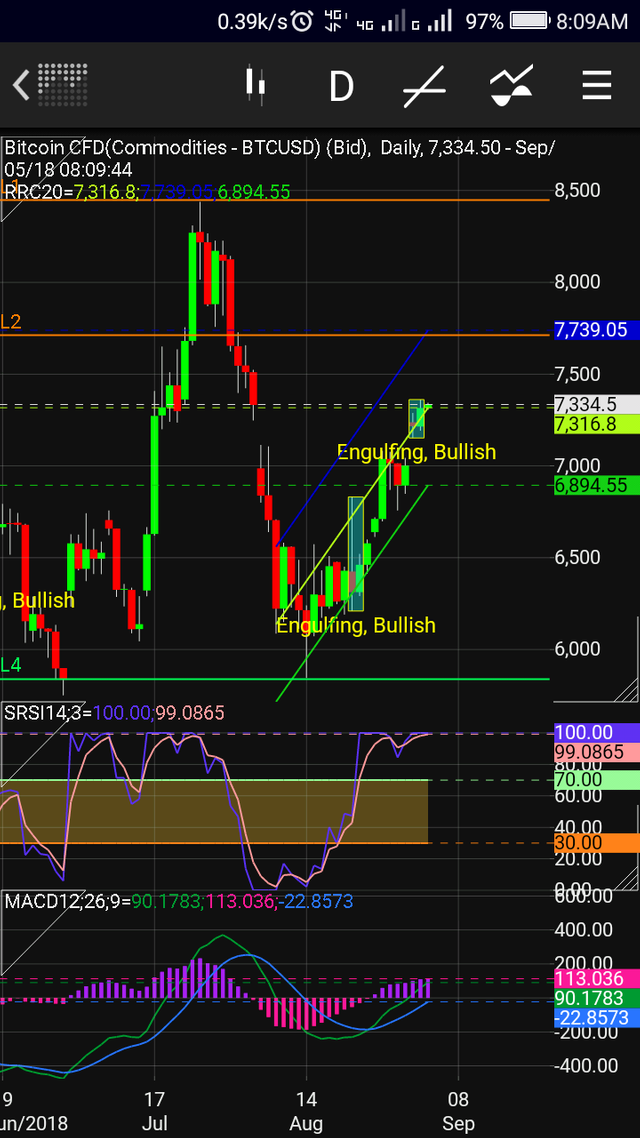
BTC/USD - Buy Opportunity Day Chart bullish engulfing . Bitcoin having some great movements lately that I've tracked perfectly so far!. Now, in my last analysis I predicted a correction which was to a support zone between 7150 and 7000.
This is still my opinion however I have al;so discovered another small zone which could be intact, and that is between 7520 and 7640. This zone is a great level which was previously the support zone of price action previously creating the last impulse and also resistance on the corrective move, meaning this zone is obviously a pivot level we can rely on to make a structure swing trade.
Price so far has just kind of limped beyond the support zone mentioned, but with no real strength at all and it's pretty weak.
I think price could have a small pop and then correct into the side-wards support line and the support zone at around 7150 which is a great biting point for a buy,
which we should watch. Until price either completes the correction or goes up and retests support zone top and runs, there is no trade here. We must wait for resolution of the current move before it's worth jumping in.
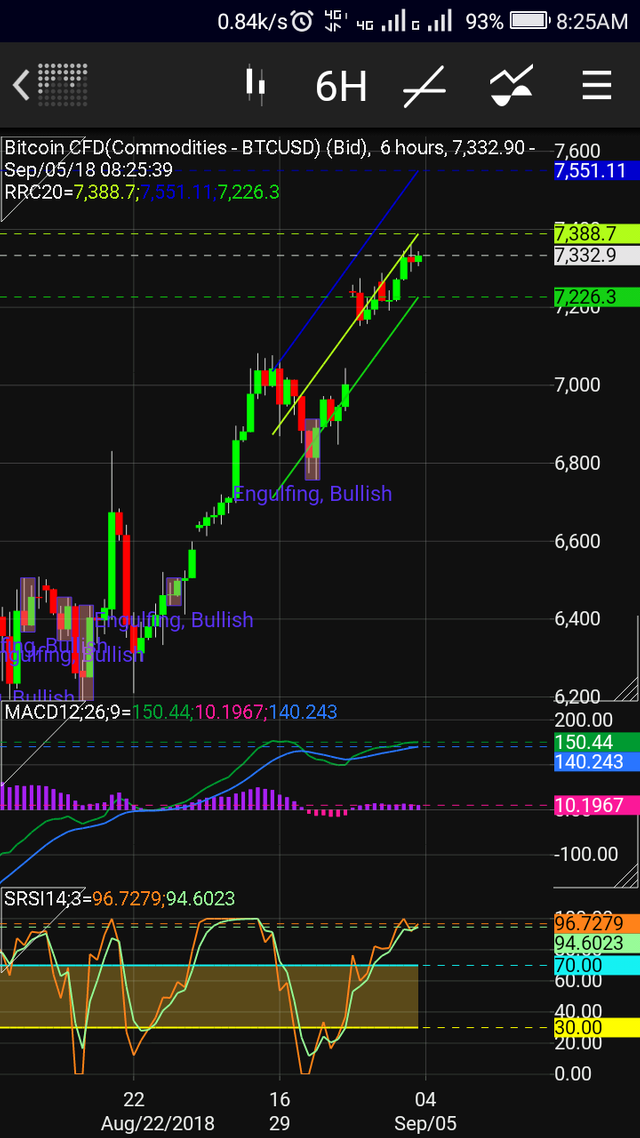
6Hour Chert Bullish Trend

nice
Nice post brother hold alt coin brother
Posted using Partiko Android