BTC chart review, Sept 8 @ 20:00 pst
The long term monthly chart has not changed much as it is still printing red heikin ashi bars for the overall bearish trend.
Stochastics do seem to be leveling off from the steep drop from the overbought area.

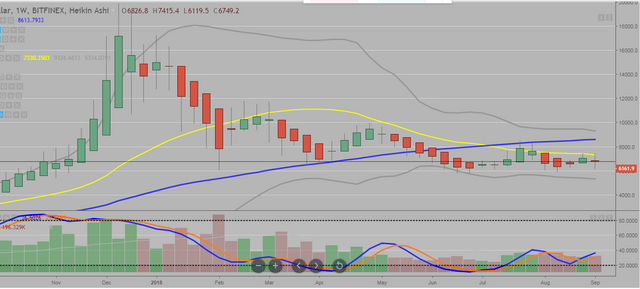
The weekly chart has the 50 wma in blue and the 20 wma in yellow. Price is under both with the 20 wma providing upside resistance over the last few weeks.
The bollinger band is getting narrow and price will usually break either up or down at some point. (Narrow bollinger bands do not last forever...)
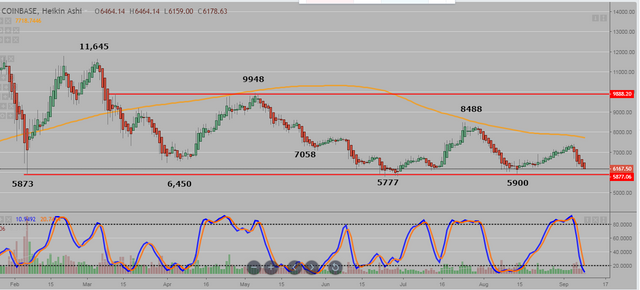
The daily chart shows the trading range that it has been in for several months. The 200 dma in orange has provided upside resistance.
Stochastics dropped like a rock from the overbought area and is now oversold. Will the lower support level hold??? We will find out in a few days...
You got a 8.72% upvote from @upme thanks to @glennolua! Send at least 3 SBD or 3 STEEM to get upvote for next round. Delegate STEEM POWER and start earning 100% from your share, daily payouts ( no commission ).
Quick delegation links: 25SP | 50SP | 100SP | 250SP | 500SP | 1000SP | 2000SP | 5000SP | Custom Amount