BTC update 29.06.18
UPDATE 02.07.18 : Get ready for the next drop. The expanded flat pattern will likely be done in the next 24 hours.
UPDATE 30.06.18 : Unexpected pump over night. Is this already wave B like shown in the count below? Maybe it is. At least we should be happy that 25B crypto pumps over night still happen^^. Nearly everthing is green today.
Today I want to talk about BTC from a pattern perspective.
There is a possible "bullish butterfly pattern" forming, which has a target of 4200$. This would fit perfectly with the WXYX2Z count. If you can't read the image, download it and zoom in.
To be honest, the route AB and route BC don't fit 100% perfectly for this pattern, but in trading you usually don't get it perfectly.
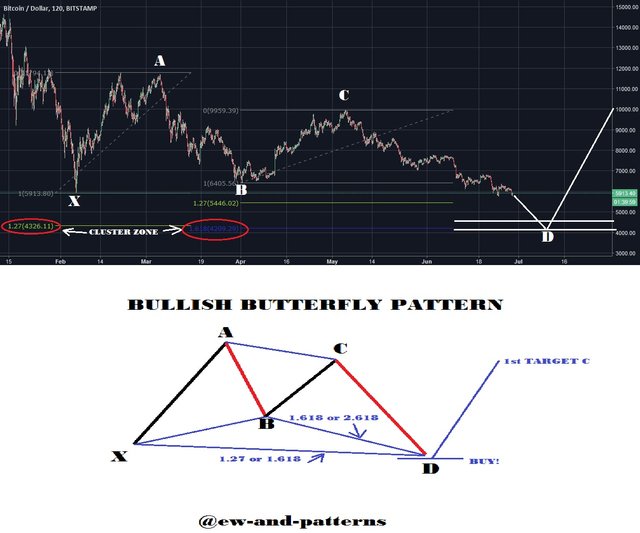
So even if it is not a "perfect bullish butterfly pattern" we still have some data confluence here:
- Fib (and also Algo) targets @ 1.27 and 1.618 extension level lining up
- bullish butterfly pattern targets
- A fitting wave count
The clusterzone of route XA extension and the route BC extension @ approx. 4200$ is very promising.
This is why it is my primary count.
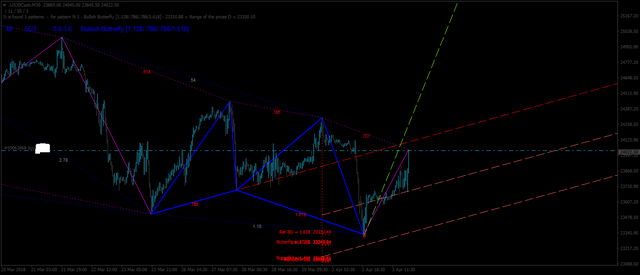
Here is an example of another bullish butterfly in the Dow from a few weeks ago:
And here is the count:
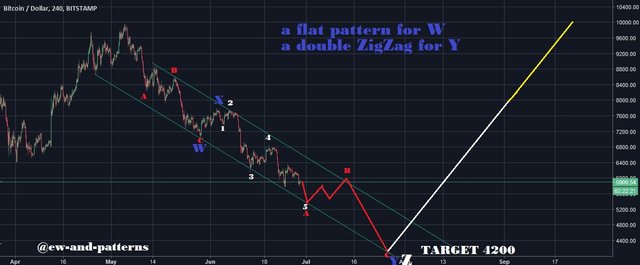
EDIT: There is a typo in the last pic. I mean "a ZigZag for Y". It is not a double ZigZag.
.png)
If you think this to be useful information:

Feel free to use and share my charts, but please mention me, @ew-and-patterns as the author. Otherwise it is considered plagiarism and I will flag you and advise my friends to do the same.
.png)
MUST READ!
DISCLAIMER: This post / analysis serves general information purposes only. I am not, and never will be a financial adviser. The material in this post does not constitute any trading advice whatsoever. This is just the way I see the charts and what my trading ideas (from my personal experiences) are. I use chart pattern and Elliott Wave analysis for my trading ideas.
For full disclosure: The author of this post is holding positions in this market at the time of this post. Please conduct your own due diligence, if you plan to copy anyones investment decisions!
If you make any trades or investments after reading this post, it is completely in your own responsibility. I am not responsible for any of your losses. By reading this post you acknowledge and accept to never hold me accountable for any of your losses.
Please consider leaving a comment, like or resteem, if this post entertained you or helped you see things differently...
Have a nice day :-)
#crypto #cryptocurrency #steem #sbd #bitcoin #btc #bch #eos #ethereum #eth #litecoin #ltc #ripple #xrp #stellar #xlm #nano #cardano #ada #vechain #digibyte #dgb #binance #tron #trx #iota #neo #xmr #dash #omg #verge #xvg #bitshares #bts #finance #money #investing
► ► Your post was resteem by way4pro.com ResteemService to over 23 k followers ◄ ◄


by @wayforhappiness , @awayforahppiness and @bitcoins1 and @upvoting
@away4pro 5 resteem more +25 upvote
Keep it up!
@ew-and-patterns
All the best!
send 0.25 SBD/steem resteem over 23k+ Follwers and ( +25 )100% upvote with 1500 steem power Send your link in memo ! @wayforhappiness Attached !
I like your count.
the $4500 - $4200 range looks like the most probable zone for a support. lets hope we see a crazy bounce up from those levels.
Thanks for the analysis!
Both studies indicate the same, interesting.
I still have hopes on rebounding around 5700 USD.
do you think after going to 4200 do we see uptrend
Uptrend yes, but even if it hits 14000 again, it could still be part of the correction and we could go back down again afterwards (a little or a lot).
Yeah, that would be fun to go to 14000 and then back to 3000. 😈
yeahh i like this possible scenario ... I have also the are $ 4000 as the maximum zone of the bearish channel ... if the price pierces that area it would invalidate my count of elliott.
Thanks!!
Also, es geht womöglich weiter runter...... festhalten und Augen zu :-)
yeah..it may goes but will not stay at that position..BTC will be back soon
Now we're talking! 100% with you
Exciting times ahead, laddering in between $4000-4500. XRP target may hit somewhere between $0.20-.25 (for those interested...!)
Very similar to what lordoftruth has been writing for several weeks now. You are even aligned with the landing zones. Great to read this as it limits the possibilities. Just hold and wait...
Congratulations @ew-and-patterns! You have completed some achievement on Steemit and have been rewarded with new badge(s) :
Click on the badge to view your Board of Honor.
If you no longer want to receive notifications, reply to this comment with the word
STOPTo support your work, I also upvoted your post!
Do not miss the last post from @steemitboard!
Participate in the SteemitBoard World Cup Contest!
Collect World Cup badges and win free SBD
Support the Gold Sponsors of the contest: @good-karma and @lukestokes
So a "bullish butterfly pattern" actually means a lower price target...
Yes. It is only bullish once the lower price target is reached^^.