BTC evening update 30.01.18
Something changed my view today. This drop doesn't fit my patterns, so I had to review the higher timeframe, which in this case is the daily chart.
From the daily chart perspective I discovered two things:
1. On the daily chart it looks like a perfect ABC pattern (5-3-5 ZigZag). It does not get better than this one.
2. In the past (going back down to 3,000$ BTC) there has never been a triple correction on the daily chart like the WXYX2Z correction, that I pointed out recently. So why have one now?
This got me thinking... Why did BTC drop today, when it was not expected at all? Then it hit me.
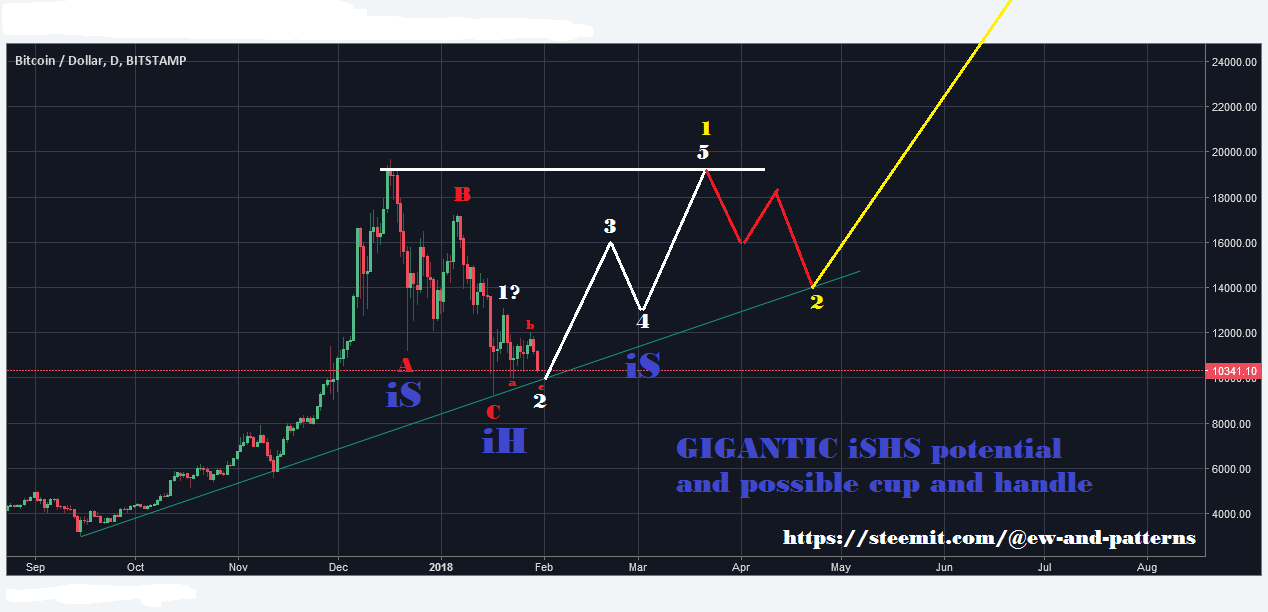
The correction might be over already. This could easily be white wave 1 and 2.
The trendline that I have drawn today might play a huge role for this theory. If we see a bullish retest, while not breaching the low @ 9,222$, I will be confident that white wave 3 is next.
A breach of 9,222$ would invalidate this count, which is now my primary count until proven wrong.
If this count is right, we will likely see a huge iSHS pattern forming, which might easily develop into a cup and handle for double bullishness. The target of this iSHS pattern would be 30,300$...
So I changed my view from bearish to bullish today. Watch this trendline and the invalidation point very closely... and stay tuned for more...
QUICK UPDATE: BTC @ 10k and close to the trendline:
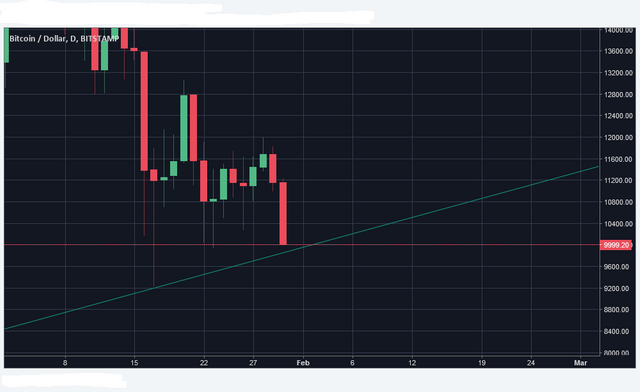
UPDATE 2: If the daily candle closes as it is now, we will have the bullish wick ;-)
.png)
If you think this to be useful information:

Feel free to use and share my charts, but please mention me, @ew-and-patterns as the author. Otherwise it is considered plagiarism and I will flag you and advise my friends to do the same.
.png)
MUST READ!
DISCLAIMER: This post / analysis serves general information purposes only. I am not, and never will be a financial adviser. The material in this post does not constitute any trading advice whatsoever. This is just the way I see the charts and what my trading ideas (from my personal experiences) are. I use chart pattern and Elliott Wave analysis for my trading ideas.
For full disclosure: The author of this post is holding positions in this market at the time of this post. Please conduct your own due diligence, if you plan to copy anyones investment decisions!
If you make any trades or investments after reading this post, it is completely in your own responsibility. I am not responsible for any of your losses. By reading this post you acknowledge and accept to never hold me accountable for any of your losses.
Please consider leaving a comment, like or resteem, if this post entertained you or helped you see things differently...
Have a nice day :-)
that would be great news @ew-and-patterns ! I was thinking when it hits 9500 we have a double bottom and it might turn bullish aswell :). Lets see what we get here :)
Wow - that is a shift of things. But I was wondering also why we are going down. Consistently everybody was expecting to go up today. Interesting to read your interpretation of it. I am wondering what the conclusion of the others are.
Now it means to be alert - the build up cash could become a problem from now to than and that is exactly what will bring the massive push in case any bullish momentum appears on the horizon.
Yup. When they realise that there might be no further low approaching for good buying opportunities, fomo starts.
Yeah - just watched update from Tone - he sees a descending triangle to be confirmed which will be most likely be broken to the downside. So next days are very interesting to see. I have 20% cash - so I am fine with both - I am happy for cheap rebuys but getting back to a bullish market is also a great thing - I can be patient with my cash.
Mainstream media is intentionally spreading Fud , They are releasing news that are month old as if they are recent news . They really want to buy the dip before pump .
I think the drop in price comes essentially from lack of buyers. Simple demand and supply can answer the question. After the tons of FUD buyers are starting to fade and weak hands are also out of the game. As I am writing this BTC is at 10,121$ and i don't see a scenario where we don't break below it. I really hope you are right, but I am kind of familiar with the psychology of weak traders/investors, so thats that. I guess we will have to wait and see ! If you are interested you can check my blog, just finished writing on the topic.
That´s interesting, but I sometimes think, that we are so desperately looking for bullish signs, that we keep on looking until we find anything that may resemble a bull ;) ...and it´s maybe not you, but in general.... or someone you know, who knows someone who maybe heard of someone who was doing that ;)))
You don't believe that how much you are useful for us because you are giving us cryptocurrency news every day. I love the way you are sharing your knowledge with us.
That's why I'm coming on your profile again and again. Keep sharing such news with us. :) Blessings to you @ew-and-patterns
Hah, nice! Thanks for sharing that idea, @ew-and-patterns. Today movement has on opposite effect on my analysis. I also thought that the correction is done, when the wave marked with 1? on your chart started to rise, and my question was if that is a 5-3-5 as a link in double zigzag or the impulse (right as you write now), but in my eyes 1 ended to early to be consider as an impulse and it looks more like 5-3-5 at the moment and also I do not find that B-C is a good match with an impulse.
My idea is that C did not over yet, so B on your chart is ii on mine and now wave iii is in action. The strength of the movement made me think like that. Please see my latest post if interested in that version.
Here is the chart:
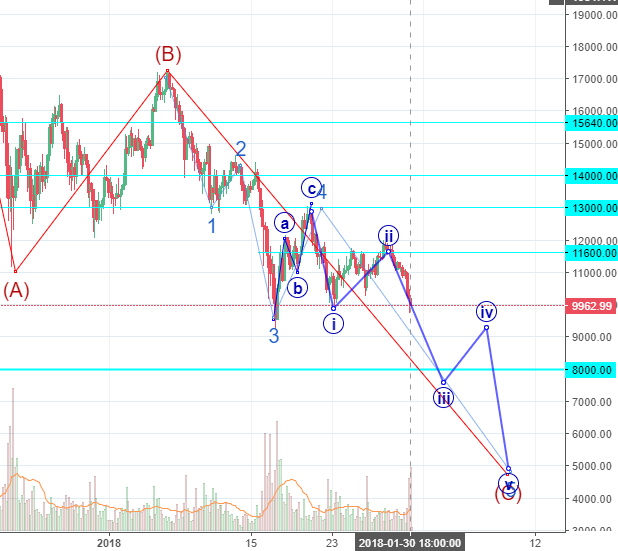
Very good observation! This is one of my alternate counts, but your target for the end of wave C is way to low in my opinion. There are some strong support zones whch will likely soften the drop.
Both of you were very helpful.
I love your TA.
To me the matket and btc could go either way. Some of it feels like 2014 and on the other hand it is hard to imagien this market not growing in 2018.
And.... BTC continues to break down.
I also do the same. Whenshit doesn’t go right, just change the lines.
Like your post
Interesting analysis ... Thank you :)
I followed you now to see more ...