[BTC] - Important indication on Weekly Chart
HI All, Crypto sludge here.
I been looking at BTC charts the past few weeks, waiting for this moment, and it's here.
And this moment is that this is the 1st time, the weekly chart will go into a bearish technical position we haven't seen since Oct 2015...
Unless some insane pump happens tomorrow and gets us above 11,700$, BTC price and the next weeks candle will move bellow the ichimoku cloud.
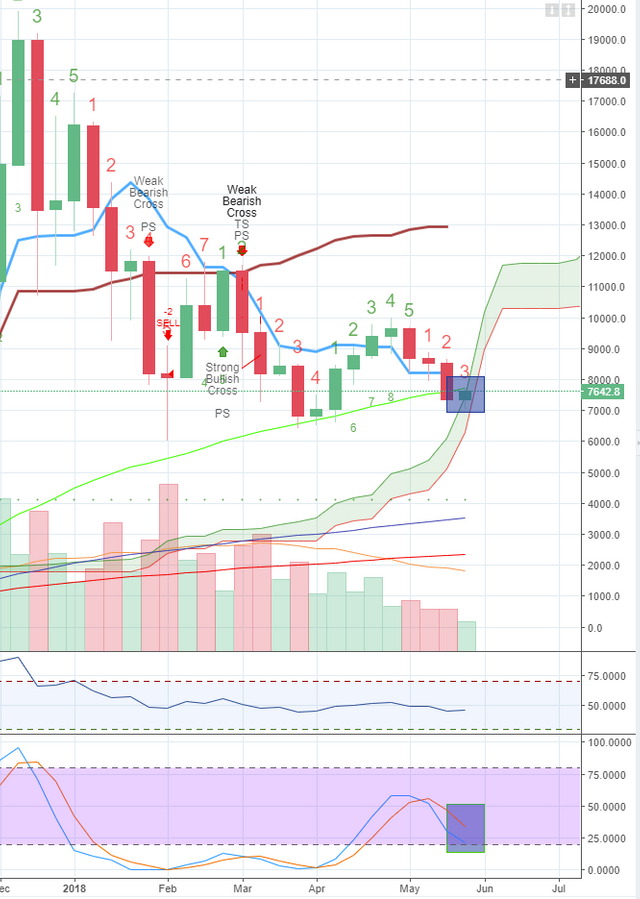
Now , this is not a typical dip bellow the cloud triggered by a sell, but more of a technical one, which is cause by the insane price action of 2017.
The sort of good thing though, is that the stoch RSI (the green square bellow) is almost in the oversold area however it still has a downward momentum, and it's still not in the oversold area.
So what is my trader take on this? first of all, we need to remember is that TA is not fortune telling. And you can't really use TA alone on your decisions, but from a pure TA perspective, it appears that if things continue as they are right now, we are looking for a continuation of the downtrend, how low can we go? TD gives us a hint with the make trend line (green dotted line) at 4k$, The 128MA , which served as good support over the years (you can read a post i made about it) shows ~3500$ and 200MA is taking us all the way to ~2500$.
And what does my gut tells me? my gut tells me, that there is a very good chance for another BTC rally this year, why do i think so? because human nature. People want to get rich, and rich people want to get richer, and with how relatively easy it is to spark up the market, someone will do it, traditional markets are still overbought, interests rates are low, people need to do something with their money and crypto still has the buzz around it.
So if i combine both views, the TL;DR is that we are probably going to get lower before we get higher.
Stay Strong.
Trade ON!
Crypto sludge.
heh ichimoku on bitcion, never seen before)
it's actually quite useful, need to obviously modify the rules a bit for 24/7 trading, but i find it a nice tool.
i hope, you will earn big profit!
appreciate the words to accompany the chart, so many don't bother. im a HODL and you've helped me clarify my time to buy more :)
Yea, TA is a lot about interpretation, you can have 3 people looking at a chart, and all of them see something else. Hope it helps, i am no prophet though :)
I Did you a transfer of 0.300sbd with my link 5 hours ago. You have not acted on it accordingly.
?
To listen to the audio version of this article click on the play image.
Brought to you by @tts. If you find it useful please consider upvoting this reply.
The best project for monitoring cryptocurrency status - https://masscoinapp.com
Check the threshold value with comfort!
What people have to realize is, it's never easy, even the first wave of people that got rich did not have a smooth ride. The only thing is.................They Believed!
Seems the downward trend would still persist for some more weeks, maybe after then there can be a gradual rise.
Resteemed and upvoted
Nice to see an updates from your side, Sludge! I am into ETH... Just because of higher velocity.
Love trading? The best app for this is https://masscoinapp.com
Any questions? Telegram support: https://t.me/masscoinsup