BTC USD ANALYSİS REPORT
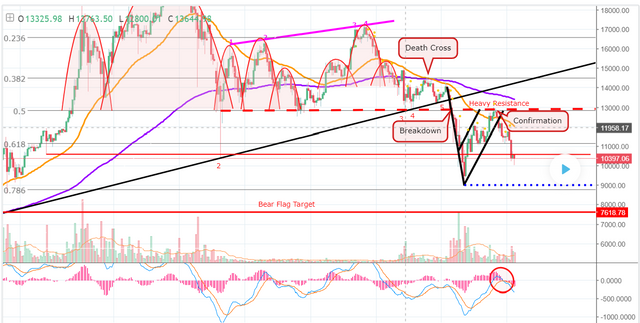
Hi friends! Welcome to this update analysis on Bitcoin! Let's jump right in. Looking at the four hour BTC 2.69% chart, we can see that the selling in BTC 2.69% is beginning to accelerate, as it plummets toward my "bear flag target." So many people didn't want to believe my bear calls. I wonder if they believe them now? We can see that BTC 2.69% has broken below the red support level . If you recall from my last BTC 2.69% post, I said that I didn't think it would be very supportive, and we can see that it isn't. In fact, it appears as though BTC 2.69% is just building a small bearish consolidation below it, at this point. Technically, BTC 2.69% appears to be confirming that level as new overhead resistance. Looking at the MACD , we can see that it's continuing to expand to the downside, as red volume begins to increase in this market. On the way down, BTC 2.69% may find support next at the previous low ($9,005,) denoted by the blue dotted trendline on the chart. Just below that, we have the 78.6% retrace, which could also be supportive. A break below the 78.6% retrace, will put the bear flag target in BTC's sights. If, by some miracle, BTC 2.69% manages to break back above the red resistance level , the 61.8% retrace would be the next upside target. Overall, BTC 2.69% has entered a zone that doesn't have a lot of downside support, so there won't be much to stop it if panic sets in. Watch those key levels, and stay safe traders!
That would certainly suck if things fell as low as $7500 but truth be told it wouldnt surprise me exactly. I mean we were at $4,000 three months ago, $7500-$8000 would seem like a more reasonable rate of growth over three months.
I dont like that thinking but seems to be what is unfolding.