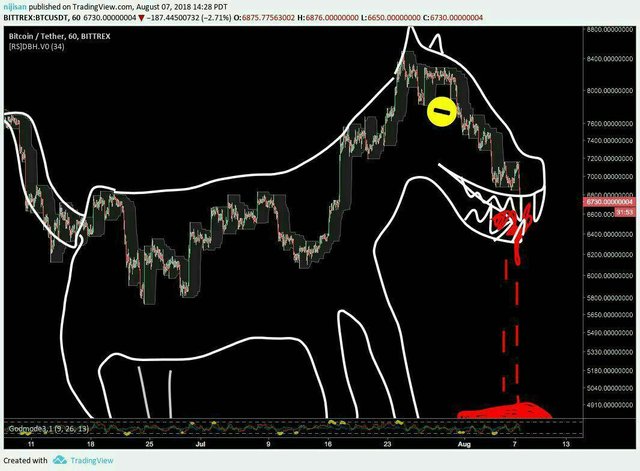
What to do if your chart has started to go left
Here by is a message to all those Facebook and Telegram experts that predict the price on my feed every day:
"Oh Thou", who in the best intentions draw a neverendless running sh&% of straight lines, squares and other shapes...
I am really sick of you (sorry, but it had to be said)! Alas, but let me help you out a little:
One of my friends had once said:
"If your chart has started to go left, you have problems!"
Any chart has only 3 direction - up, right or down. When you publish your predictions (that are certainly based on godonlyknowswhat and not analytics), and then literally scream about how you were right about the price... Please people... But if you publish 3 different "predictions" (to the moon, down the hill or stagnation) (by the way, that's what you all do, then my-oh-my, you will eventually be right!
I kind-of stole a picture here (can't remember where exactly), but here you go: receive and sign. Thank you and goodbye. A grand pardon if I offended anyone's feelings.
May the "to ze moon" be with you...

Like the text. I understand from this writing. If any image starts from the left, it can be problem. I could learn something from it. It would be nice to post such post. I can learn something in it.
What is this chart? So how can we work?
You write well, @serejandmyself!