Crypto Contest March 31: Dvision Network
Dvision Network (Bithumb: DVIKRW) has broken out of the triangle pattern in the four-hour chart.
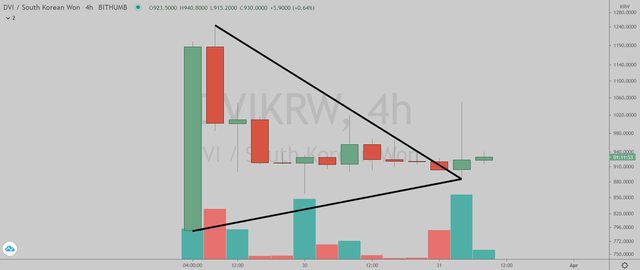
(Chart courtesy of Tradingview.com (log scale))
Elliott Wave Analysis
In Elliott Wave terms, DVI began a red wave one advance on March 29. The red wave one peaked on March 29 and the red wave two (blue sub-waves a-b-c) correction ended on March 30. If this wave count is correct, DVI should be heading next towards the March 29 peak in the red wave three.
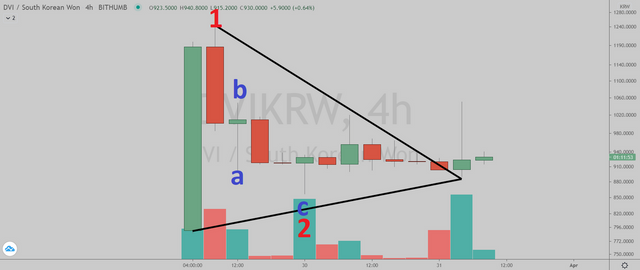
(Chart courtesy of Tradingview.com (log scale))
Funnymentals
Dvision Network is a blockchain-based VR content ecosystem, which also powers the NFT marketplace within virtual reality. CGC reviewed the project three months ago.
(Sources: https://dvision.network/)How Will Dvision Network Trade?
Dvision Network (Bithumb: DVIKRW) four-hour chart by Tradingview.
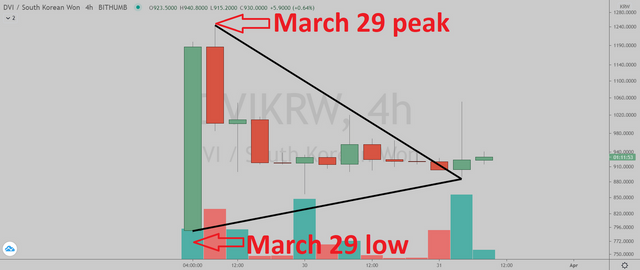
(Chart courtesy of Tradingview.com (log scale))
Prizes
I will be giving upvotes to the correct answers with minimum reputation of 25.
Rules
This poll will expire in one week. Only one vote per person.
Which one will happen first?
Please select one of the three choices and comment below.
DVI will takeout the March 29 peak
DVI will drop below the March 29 low
DVI will stay in a trading range between the March 29 low and the March 29 peak until May 7
DVI will takeout the March 29 peak
Correct. Upvoted your post:
https://steemit.com/steemit/@simonjay/daily-steem-price-update-19-4-2021
DVI will takeout the March 29 peak
Correct. Upvoted your comment:
https://steemit.com/blockchain/@yuliyan/qrk3mx
DVI will drop below the March 29 low
DVI will drop below the March 29 low
DVI will stay in a trading range between the March 29 low and the March 29 peak until May 7
DVI will takeout the March 29 peak
Correct. Upvoted your comment:
https://steemit.com/blockchain/@yefet/qrk05a
DVI will stay in a trading range between the March 29 low and the March 29 peak until May 7
DVI will stay in a trading range between the March 29 low and the March 29 peak until May 7
DVI will stay in a trading range between the March 29 low and the March 29 peak until May 7
DVI will takeout the March 29 peak
Correct. Upvoted your comment:
https://steemit.com/blockchain/@gbk78/qrosxv