BitShares BitCNY and BTS Market
Let's take a look at Liquidity in the BitShares BitCNY and BTS market. I believe this is the most liquid market on BitShares. Here is a look at some numbers on it.
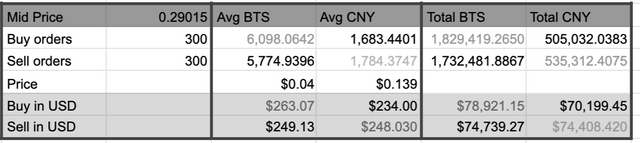
Currently, the price midpoint is 0.29015 CNY for one BTS
This market is made up of two assets. The first asset is BTS which had a recent price of $0.04314 and had a market capitalization of $118,165,243 with 174,556 accounts or people holding it This market was ranked 5th on activity based on a 24 hour trading volume of $251,221.
The second asset is CNY which had a recent price of $0.1389 had a market capitalization of $8,024,306 with 32,604 accounts or people holding it This market was ranked 2 on activity based on a 24 hour trading volume of $2,751,735.
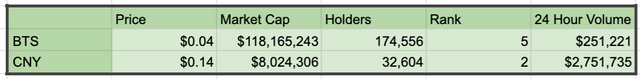
Generally, these numbers need to be taken with a grain of salt. The account numbers can include everyone who ever traded an asset and may need to be reduced by about 80 to 95% in order to get close to actual holders today.
So let’s take a look at up to the top 300 orders on both sides of the market.
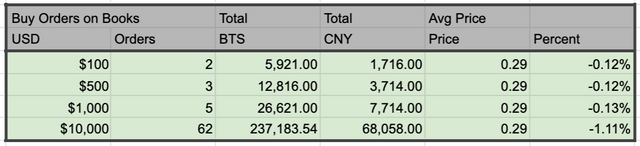
There are 300 buy orders.
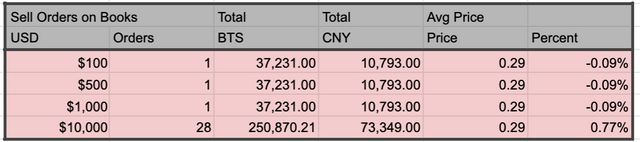
There are 300 sell orders.
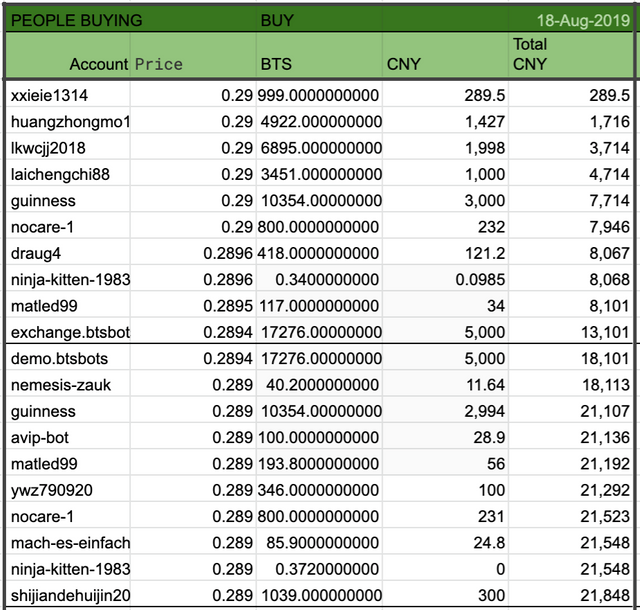
Let’s look more closely at the buy orders
The total buy amount is 1,829,419 BTS and 505,032 CNY
The total sell amount is 1,732,481 BTS and 535,312 CNY
The average Buy order is for 6,098 BTS worth about $263.07
The average sell order is for 5,774 BTS worth $249.13
In total on the buy side there is about $78,921
In total on the sell side there is $74,739
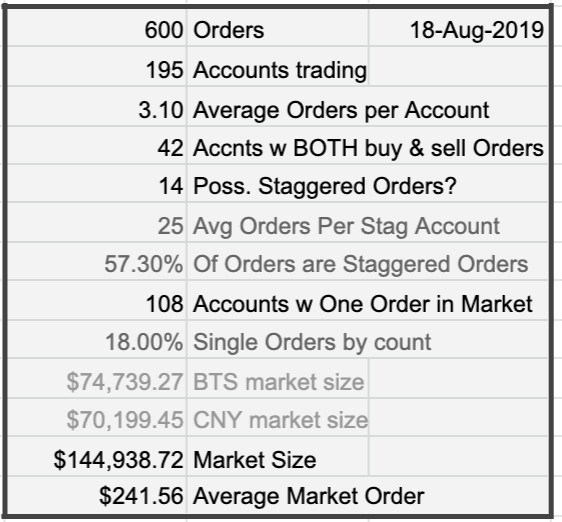
So some accounts have multiple orders in them
We are looking at 300 buy orders and 300 sell orders for a total of 600 orders.
There are only 195 accounts trading in this market
That means each account on average has 3.1 orders.
So let’s take a look at what would happen if you wanted to sell.
Here are a few of the orders on the order book.
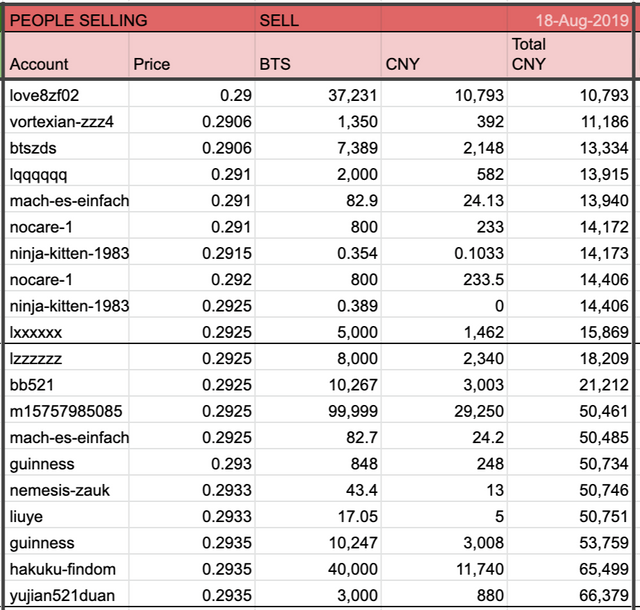
We will look at the orders 10 at a time to get a little better understanding of liquidity, size and price that is available.
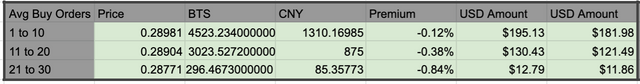
For the first 10 buy orders out there, 4,523 BTS for 1310CNY or about $195.13.
For the second 10 buy orders out there, 3,023 BTS for 874CNY or about $130.43.
For the first 20 to 30th buy orders out there, 296 BTS for 85CNY or about $12.78.
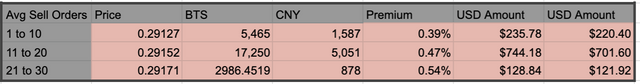
If you wish to buy immediately and you took the top sell orders on the book this is what it would look like.
The first 10 sell orders offer up an average of 5,465 BTS for 1,586 CNY or about $235.78.
The second 10 sell orders offer up an average of 17,250 BTS for 5,051 CNY or about $744.18.
The 20 to 30th 10 sell orders offer up an average of 2,986 BTS for 877 CNY or about $128.84.
Details
So these reports are brought to you by Cryptick who is involved in the BitShares Dexbot Project.
BitShares is an exciting decentralized Block Chain Based Exchange.
Being Decentralized, things just sort of happen, people step up and do things as need may be.
These statistics are believed to be true, but there is probably some miscalculations in them please forgive me.
If you see a problem with the statistics let me know and I will try to hunt down the offending formula and calculations.
Most of the data in these reports comes from Cryptofresh.com, a BitShares blockchain explorer.
The main purpose of these reports is to help people understand the liquidity on the BitShares markets.
One little detail on this report, the data feed does not include the buy wall/ sell wall of margin calls when applicable. Those familiar with Cryptofresh know that for whatever reason those orders are filtered out from the order book. There are tons of little details like this that need to be considered when looking at data. Obviously, this data was pulled over the weekend, and also it all changes minute by minute so whatever is published is wrong as soon as another order is filled. All that said, the general order book and the feel of the market is the same.
Market makers are a critical part of the BitShares Ecosystem, many times we like to work behind the scenes providing the grease that makes the system work. At times it is necessary to take a closer look at this so everyone knows how things work, and have a good feel for the system.
Business Statistics and Business Intelligence is a critical aspect of any enterprise, BitShares is a decentralized enterprise and a decentralized organization. As a result it does not have a business intelligence and statistics department, to help fill in the need various people step up and provide data from time to time. Fortunately, there are several block chain explorers that help one understand many of the crucial statistics, however there is much more that needs to be explored understood and considered in the business environment. This series of reports is about filling in that need, covering the gaps and helping make sure that people understand the liquidity that makes these markets possible. Liquidity is made up of many different things, it is the number of people in the market, the number of accounts, the number of orders, the number of bots, the price, the depth, the average order size. These numbers can be sliced many different ways. Here I am trying to slice and dice the numbers in multiple ways, helping everyone look at the multiple aspects of this liquidity equation. Beyond one market, one needs to do this at multiple markets and then compare the markets with each other. It is complicated, and it takes times and consideration in order to understand things correctly. It can also be very easy to misunderstand things, but looking at the data multiple ways those misunderstandings will generally tend to straighten themselves out.