Using the ancient method of zodiacal releasing - is bitcoin repeating a pattern from fall 2013?
Four years ago today at exactly this time of year, bitcoin had a manic run up to about $1200. It's one of those recurrences that reminds me that we don't live in a random universe. I'm not convinced that the stars are actually "doing something" to make these cycles happen other than being predictable in their motions which gives us the ability to render the universe we live in intelligible by marking out spaces and intervals. I'm pretty sure that we can rule out efficient causes. See Why I don't believe in Astrology (but still use it).
Here is the chart as it looks today (long view) on Coinbase:
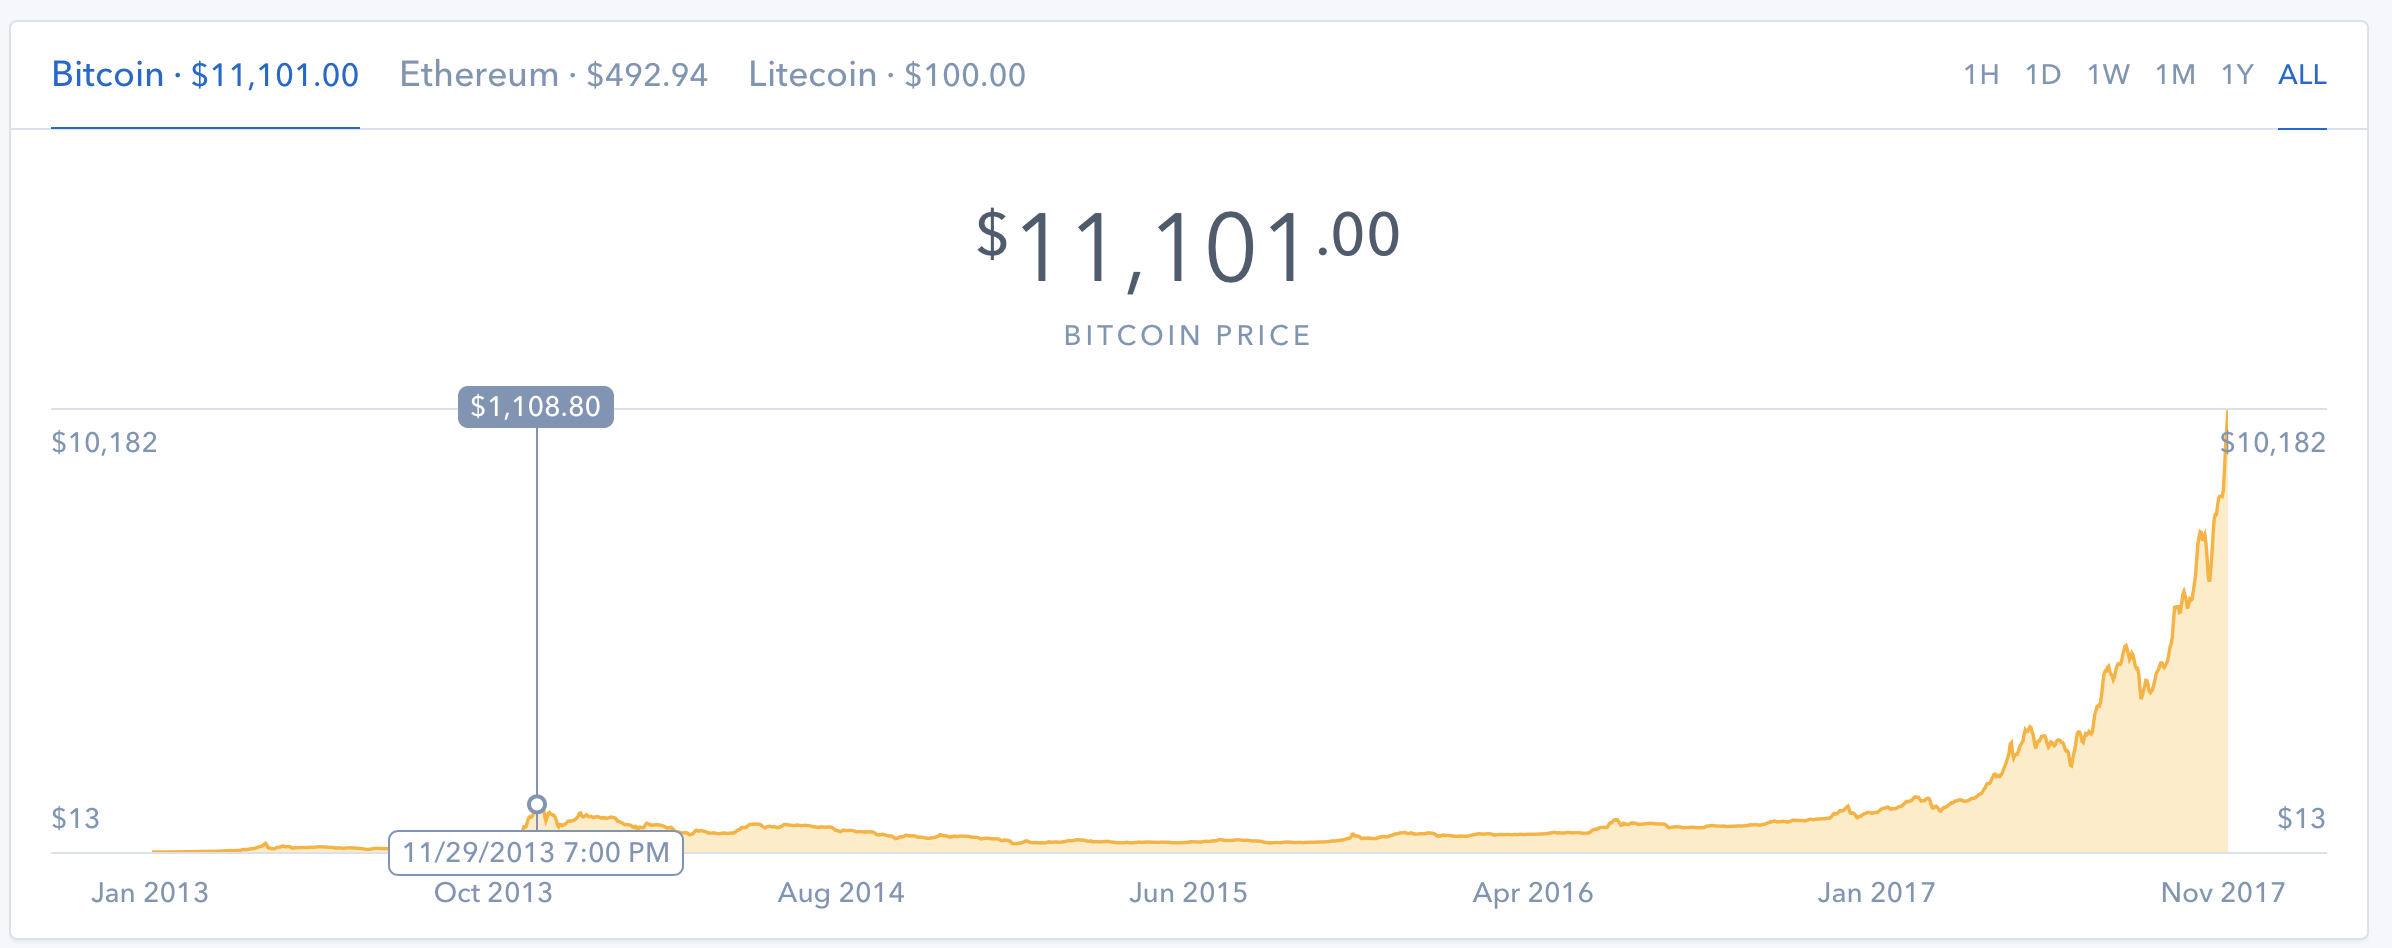
One might think that the next stop would be $5,000 - $6,000. Repetition is quite common in nature. When you go against the prevailing wisdom and say that "this time it's different", most of the time you will be wrong. We may see a correction, but I think that today while it looks like a spectacular coincidence, the institutional money flowing in could make Nov 30th just another point on the line (and not the high).
I have a speculative chart of the bitcoin genesis block (the location is probably wrong), but because of the symmetrical nature of the zodiacal releasing method (1 cycle of Cap = 27, then add Sag 12 and Sco 15 = 27 and on the other side Aries 15 and Pisces 12 = 27) you can generate a lot of coincidences which can be mapped against. I wrote the cross platform software Delphic Oracle that calculates this Hellenistic era procedure:
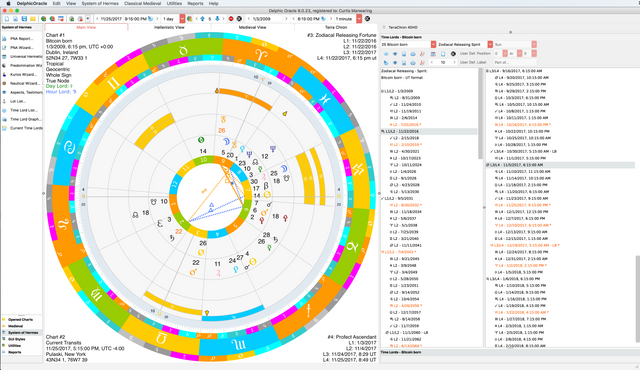
The goal here isn't to analyze the chart in this case but to simply look for repetitions. About the only thing you have to grab onto here are phasis points. In Hellenistic astrology, when a planet changes direction and goes from direct to retrograde motion, this is considered "a phasis that speaks". Valens considered such events "chremastikoi" (which means busy or telling). In other words a change of direction is telling you something, but a flat line is mute.
Sometimes recurrence cycles don't pan out (we aren't dealing with efficient causes here), but because of the non random nature of patterns, it's better than simply relying on chance. Theoretically it is better if you're working with a correct chart, but even if the chart isn't correct, using the method in this way is simply like taking your wall clock and turning it 90 degrees and then using ticks in their original space as markers for pattern.
Imagine your wall clock has the hour hand pointing to the 6 and is pointing straight down. There's a lot of traffic going on outside. Dinner is being cooked. Office buildings are vacating. We can probably extrapolate from this that it's more likely that it's a weekday than a weekend since the weekend pattern will be a bit more diffuse in this area.
Now imagine that I turn that clock at a 90 degree angle so that the hour hand is pointing to the right. As long as we don't assign meaning to the hour hand in itself, but only use it as a marker for a regular pattern, we can count on negentropy to manifest.
In this particular chart, the periods marked by Capricorn and Scorpio (those involved in the cycle of 27 units through summation of Sag which lies in between) on the bottom right of the chart seem to show increases in price generally. If this chart is part of the flip side of another possibility (a probability of 1/6th in a 12 zone division such as the zodiac) then Feb 2018 - Feb 2019 marks a "bear" market.
There's a hazard here of course... a bear market compared to what? In retrospect we might look back on this period and find out that was when bitcoin crashed down to $20,000 / BTC. That of course would be another $9K above the current mark.
Now notice that in the level 3 / 4 periods when Capricorn (the cycle of 27 lies):
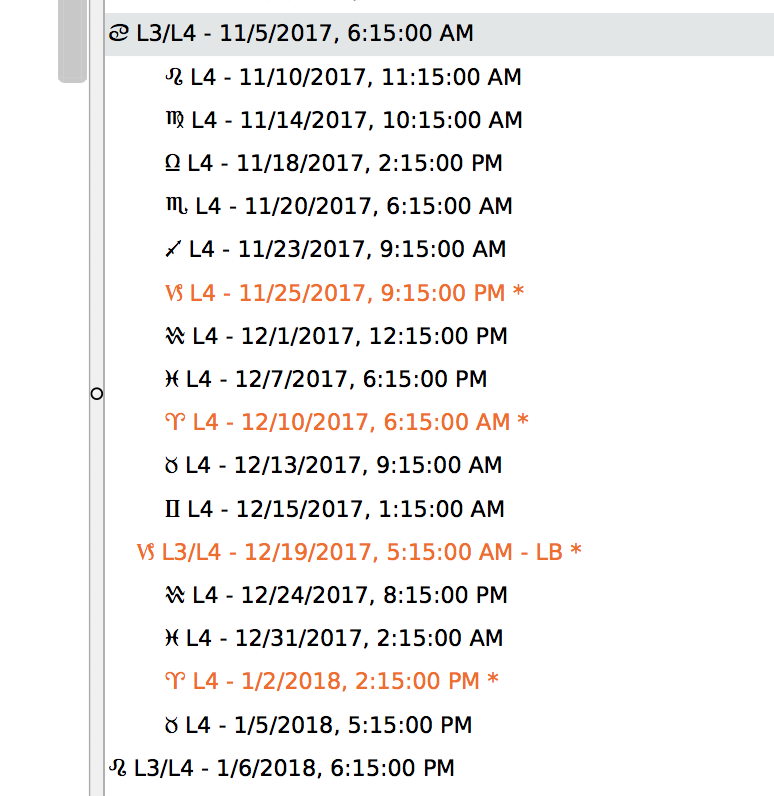
The run up that just happened in bitcoin might repeat Dec 19th up till x-mas.
If we can see a microcosm pattern here, then what does that suggest for the Scorpio, Sagittarius, Capricorn part of the cycle at the macro level (level 2)?
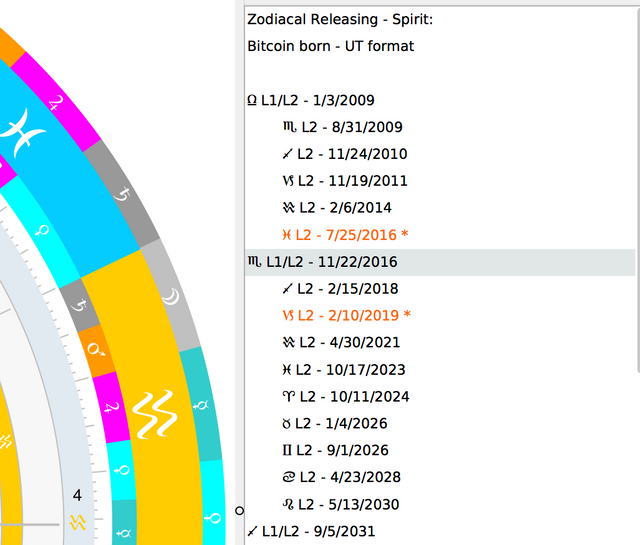
Notice that Feb 2019 is the same part of the cycle that happened in fall 2013. Of course the run up happened after the loosing of the bond in the sub periods (toward the end of the 2011 - 2014 period) so we might expect that the recurrence of the pattern would occur toward the end of the Capricorn period that starts in 2019. This suggests a time table of very early 2021 for another peak.
Of course we do not need to try to work completely blind. We have something other than random opinion and knowledge of what is actually going on in the cryptocurrency space. One should not consider this the "chart of bitcoin". It's a chart of an event which set all cryptocurrencies into motion (sort of like a big bang moment for crypto).
If using ZR spirit pattern doesn't work as well as something else (maybe because Satoshi Nakamoto was in Austrailia), that explosion might have created a pattern in a different direction. It would be nice to develop a bayesian statistical model for this.
Donations (public bitcoin address):

3FwxQsa7gmQ7c1GXJyvDTqmT6CM3mMEgcv

well post i love it thanks for shearing
Awesome post Zoidsoft! Very intriguing if this comes to pass...
This post has received gratitude of 2.06 % from @appreciator thanks to: @zoidsoft.
This post has received a 0.68 % upvote from @buildawhale thanks to: @zoidsoft. Send at least 1 SBD to @buildawhale with a post link in the memo field for a portion of the next vote.
To support our daily curation initiative, please vote on my owner, @themarkymark, as a Steem Witness
This post has received a 19.52 % upvote from @boomerang thanks to: @zoidsoft
@boomerang distributes 100% of the SBD and up to 80% of the Curation Rewards to STEEM POWER Delegators. If you want to bid for votes or want to delegate SP please read the @boomerang whitepaper.
This post has received a 1.28 % upvote from @booster thanks to: @zoidsoft.