Bitcoin Price Trend Analysis: MAJOR COLLAPSE INCOMING!?
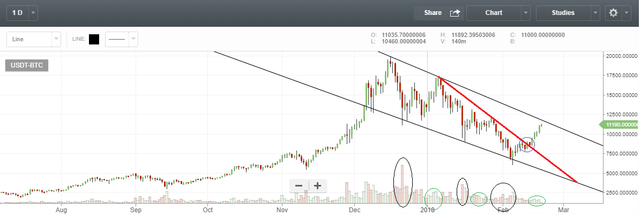
This is the price chart for bitcoin since July of last year. Each red or green "candle" represents a single day.
Bitcoin and the cryptocurrency market in general are in a very ambiguous place right now, from a technical perspective, but this is probably a make-or-break moment for the short term.
As you can clearly see, bitcoin peaked in December at almost $20k per coin, and then fell precipitously and with great volatility all the way down to $6k per coin. Since then, prices have almost doubled again to 11.19k, almost straight up.
The first two peaks of a decline typically establish a "resistance" line whose downward slope acts as a ceiling for prices until the decline is over. If we extend that resistance line out, we see that it puts its price ceiling today just above where prices have climbed. There is an especially strong possibility of a reversal back into price collapse when it hits that line. However, it breaks past that line and holds for a day, then there is an especially strong possibility for prices to start another crazy rally for which bitcoin is famous.
Bulls (optimists) argue that the real resistance line was the red one starting from the peak in January, and if you use that as your trend channel, then you can see that BTC clearly broke out of it several days ago. They further their argument with real world news, citing a conclusion to the panic about government regulations, the magnitude of the collapse from 20k to 6k and consequent interest from professional investors, and various big, positive news items expected in the coming weeks and months related to software upgrades for the major coins that should improve speed lower costs of transactions, finally rivaling or surpassing credit cards.
Bears (pessimists) like me are concerned that this recovery is a bull trap along the wider channel of descent bounded by the black lines I've drawn. It is definitely possible that we'll see prices fly away again like crazy, but my personal opinion is that the most likely case is that prices will rise a bit more, perhaps spike eye-poppingly for a moment, and then return to major collapse, down as low as 5k per coin. 3k is even worth mentioning still as a possibility.
In addition to the trend lines I'm seeing, I also would like to call your attention to the volume bars at the bottom. Observe how we've had roughly three cycles of boom and bust in this down trend, and each time, the volume has been much higher on the descent than the ascent. The pattern of price and volume has not changed; we are seeing a rapid price explosion on relatively very low trading volume, for a third time. The previous two times this occurred in this trend, prices collapsed once they reached the resistance line. Prices are a few hundred dollars below the resistance line again.
I will probably be selling many of my positions at around $11.4k per BTC (but my lack of confidence in this assessment means I'll hold some, as well).
What do you all think?
thx for your analysis! it definately is a good one
though i personally think BTC is going to hit 12k but i guess there are many ways of interpreting charts..
it s a shame i am only holding alts for now.. should have had BTC instead
Thanks for your input!
I would not be surprised at all if it hits 12k before collapsing, and I might even feel a little bad about missing that peak, but my experience trading has shown me that I will regret it more if I set my orders too high and they don't hit at all vs. setting them too low and missing out on a fraction of the gains I could have had.
I also wouldn't be too surprised if I'm completely wrong and there is no collapse at all, but I'm definitely sure enough to make some trades based on the assumption a collapse is coming. I leave it to each to decide their own levels of confidence and risk/reward.
Greed has cost me a lot in the past, so because I'm greedy, I stop being greedy to enhance my greed. Know what I mean?
Thank you for your honest feed back!
I do agree that FOMO makes you more prone to losses
I used to set the goals high.. but seeing that BTC is dropping again right now, i feel like being a bit conservative and safe like you might be the better way of trading especially in market state like this
I will keep track of your posts regularly
You do seem to know what you are talking about :)
it would be a great help in my trading as well
The moment of truth:
If it can push back up above the line and close there, then that's a very strong bullish signal. If it cannot stay above that line, I'm getting out quick. How about you?
Uhhhh i see that too
But it seems like it doesnt have enough power to break the line and go up
May have some correction for sometime i guess?
Thank you for your thoughts! Its very informative. I m folliwing your ideas :)
Coins mentioned in post:
For more Analysis to @a-blockchain
Quick update:
I hope those first few of you who viewed this before 6:00 p.m. yesterday were able to take some profits with me before that correction! I had thought we had a few more hours to go, maybe even more than a day, but I was wrong, and I didn't sell as much at the top as I could have. I hope you fared better!
Meanwhile, we are all still wondering whether that was a correction on the way up, or the harbinger of a larger fall. As of right now, I just watched the bears bust through 10.5k on GDAX, and I anticipate they will continue.
We had the immediate reaction from the correction just now that did not come close to reaching the previous high, and then we had a second attempt at a rally that flopped before reaching the previous high again.
These next few hours will be critical in my determination of whether to sell more or wait. I am putting a stop loss at 10.1k, because that's where the last dip stopped, and if we go below that again after failing to reach 11.2k, then it is a very strong bearish indicator.
However, I think the most likely case right now is a consolidating wedge around 10.6k, followed by a big move up or down -- and my money is on "down."
Even if it does break above 11.2k, I will still be very cautiously on the lookout for another bull trap. This apparent recovery since 6k has been very unconvincing to me. What do you all think?