Bitcoin Price Analysis for January 31, 2018 - Another Bearish Wave
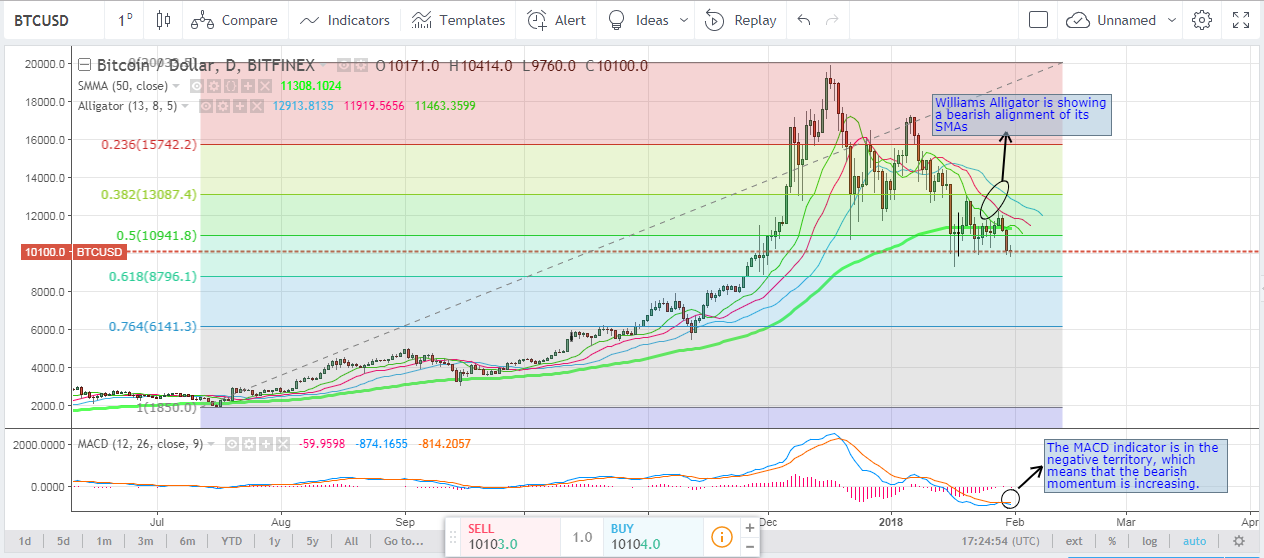
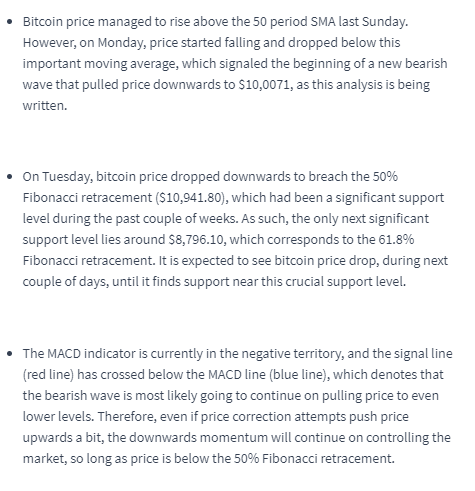
Bitcoin price has been falling throughout the past 48 hours. After scoring a high of $11,250, BTC price fell down to a low of $9,860 on Tuesday’s. The market's bears managed to pull price downwards to break through the 50% Fibonacci retracement around $10,941, which represented a crucial support level throughout the past couple of weeks.
Will the current downwards trend continue pushing bitcoin price to even lower levels?
The support at the 50% Fibonacci retracement has been breached:
Let’s examine the 1 day BTCUSD chart from Bitfinex. We will keep the Fibonacci retracement we plotted during our previous weekly bitcoin price analysis, while executing the 50 period SMA (green curve on the below chart), the Williams Alligator indicator, and the MACD indicator as shown on the below chart. We can note the following:
Click here to continue reading the analysis on Cointelligence.com
Yeah I agree looks like we are going down to 7500-8000 I think that is conservative. Maybe 6000-6500
Just started following you. Great post. Let me help you grow. Please consider my blog. I currently have 70,000+ followers on Youtube, Twitter, and here combined where my goal is to help improve the crypto community. I'm a reputable analyst in the community with high accuracy calls, and a focus on improving YOUR trading game in a concise and educational manner.

https://steemit.com/bitcoin/@philakonecrypto/bitcoin-btc-feb-1-in-depth-fundamental-and-technical-analysis