what is Candlestick? why you should learn it
Put simply, candlesticks are a way of communicating information about how price is moving.
Candlestick charts are available on ThinkForex trading platforms for all assets individuals can trade
on the platforms. Below is a sample of a candlestick chart derived from the ThinkForex web trading
platform:
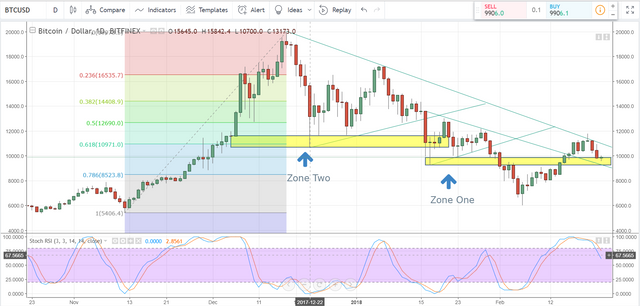
This chart shows price on the right (vertical) axis, and time on the bottom (horizontal) axis.
Moreover, the chart is made of bars that have little lines stemming from the top and the bottom; these
are known as candles. The candle conveys four pieces of information:
- The open price 3. The high price
- The close price 4. The low price
Candles refer to that information for a specific unit of time. For instance, the chart above is a daily
chart; each chart represents one day. And thus, each candle constitutes, the open, close, high, and low
price for that given day. The horizontal axis at the bottom of the chart can be used to understand
which day corresponds to which candle. Below is an image that illustrates how those four pieces of
information the open, low, high, and close for a given period of time are visualized in the context of
a candle:
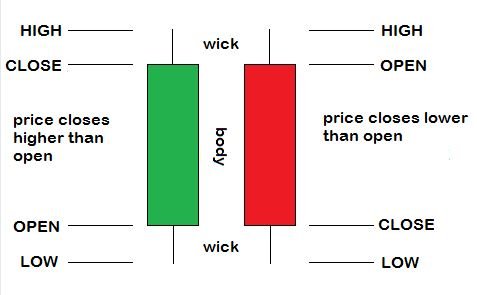
The wicks, or shadows, are the thin lines that go outside the rectangular body of the candle.
They represent the high and the low price during that time period.
The color of the candle is also significant in understanding whether the open price was higher or
lower than the close price. If the candle is red, or denoted as bearish in some other manner, this
means that the open price is lower than the close; and the opposite is true if the candle is green, or
denoted as bearish.
@stockmarketinfo You can read ....