Will Bitcoin break $10,000 within a month? [Intro to Basic Technical Analysis]
It’s fun to estimate price movements of assets in general. It’s especially fun to speculate on Bitcoin because of its extreme price movements. The price movements are also nothing new and shouldn't deter you from investing in Bitcoin for the long run. Where is Bitcoin’s top this time around? How do we know we aren’t there already? If you believe in Bitcoin's fundamentals, it may be better not to worry and just buy and hold for the long run. Buying and holding, accumulating and dollar-cost averaging are probably the best strategies for most people, especially for those without a lot of time.
Technical Analysis
For us speculators, one of the methods people use to try to predict price movements is called technical analysis. Technical analysis is simply a method of trying to predict future price movements simply by looking at past prices. The idea that technical analysis can help is contrary to the random walk or efficient market theory that suggests that past prices can’t be used to predict future prices. Most academics and finance professionals subscribe to efficient market theory and it would be hard to argue against them since there are only a handful of cases of those who have used technical analysis with great success. To be fair very few consistently outperform the average using fundamental analysis and efficient market theory applies to fundamental analysis in the same way. Yet fundamental analysis has a much better reputation. Professionals associate technical analysis more with witchcraft or voodoo magic. I would guess over 99% of speculators that use technical analysis underperform those that buy & hold after trading fees & taxes. However, perhaps there is about 1% of those that use technical analysis who are able to use it to gain a consistent edge, especially if random walk theory isn’t quite valid.
there's something called the efficient market theory which says that there's nothing in the data, let's say price data, which will indicate anything about the future, because the price is sort of always right, the price is always right in some sense. But that's just not true. So there are anomalies in the data even in the price history data...
-- billionaire Jim Simons, Renaissance Technologies, one of the most successful quant hedge funds in history.
So I wanted to do a blog series on technical analysis to cover some of the most common indicators and strategies and hopefully give those that are open-minded an edge in their trading.
Support & Resistance Levels
The first basic concepts I wanted to discuss are support and resistance levels. A resistance level is a price ceiling that people believe to be difficult for an asset price to go above. A support level is a price floor that people believe will be difficult for an asset price to go below. Oftentimes an asset achieves an all-time high price due to some fundamental news or irrational exuberance and subsequently falls significantly. The all-time high price creates a level of resistance that is difficult to surpass unless there is more exuberance, fundamental drivers or broader interest than what took the price up to a previous high before. When an asset price breaks above an all-time high, that all-time high price becomes a support level that future prices should stay above in a general uptrend. On the other hand when an asset price breaks sharply below longer term lows (ie. support levels), a resistance level is created that could be part of a longer term downtrend.
Right now Bitcoin is at its all-time high. Its previous all-time high before 2017 was in 2013 when it reached roughly $1160. When prices broke above the previous all-time high resistance level that was likely a good signal that another Bitcoin boom was coming.
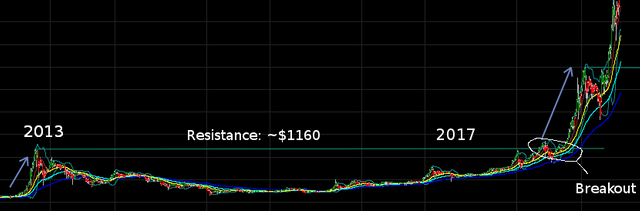
In March of 2017, Bitcoin broke through the resistance level set in 2013 to reach all time highs to $1,350 on expectations of an SEC approval for a major ETF. However it broke down below the new support level (ie. previous all-time high) once the ETF was rejected. In just a month Bitcoin prices crept back up over the resistance level, suggesting the ETF news was not that significant overall. Once the prices remained above the previous resistance level for over a week it quickly surpassed the more recent $1,350 high resistance level in March and broke out to just about $3,000 in June.
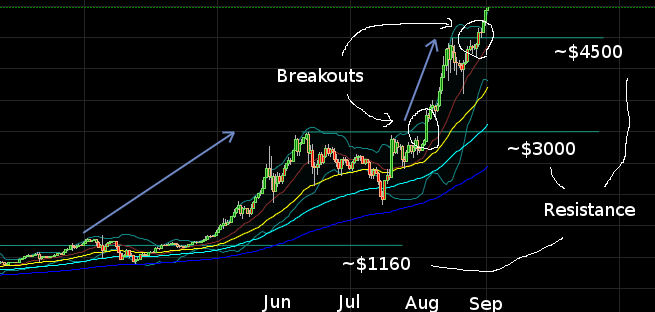
Above is a Bitcoin chart for 2017 that shows shorter term resistance and support levels. You can see the large price move from about $1160 in March to $3000 in June (before the hard fork in August). After segwit activation and the Bitcoin Cash fork I thought we were in the beginning stages of a crypto-bear market and that there wouldn’t be enough momentum to go beyond $3,000 in my previous blog post, but once it broke past $3,000 with incredible strength I was bullish again. In the last post I wrote “The upside is Bitcoin seems to finally be moving past a multi-year standstill on Segwit & hardforks. That may be a huge relief to the Bitcoin community. Will that be enough?I don't think so, but I'll change my tune if Bitcoin breaks all-time highs with some good strength.”
The reason I made that statement was precisely because I favor using resistance levels and breakouts during large moves such as the one Bitcoin currently is in. Bitcoin broke the $3,000 resistance level with strength. Just recently the price hit $4,500 to set up another resistance level, prices subsequently fell, but there was another break out in the last few days and is moving upwards with continued strength.
So how do we trade using these support & resistance level concepts?
You can use resistance levels as a momentum strategy. When prices break through resistance levels to new all-time highs you can get in early and ride the move upward. For safety you can also set up stop-losses below previous all-time highs because previous resistance levels turn into support levels.
On downward or sideway moves, you can also sell an asset when it gets near resistance levels just in case there isn’t enough momentum to break through them with strength.
I’ll be talking about moving averages, RSI, oscillators, volume indicators, bollinger bands, fibonacci retracements etc. and apply them to Bitcoin and other cryptocurrencies. Will Bitcoin hit $10,000 in a month? There seems to be considerable momentum for that to happen so I’ve been bullish after it broke $3,000. Keep your stop losses below significant support levels and might as well ride the wave to see where this goes right?
So what are your thoughts about 1) Bitcoin prices 2) technical analysis in general?
Note: This is for educational purposes only.

Bitcoin has revolutionized the definition of money I think it's a fantastic tool and even better store of value over time.
For my technical analysis I use Stochastics along with Bollinger Bands and Fibonacci Retracement. I normally look for resistance and support levels as well as using some market sentiments to guide my price forecasts.
I would like to see Bitcoin break $10,000 in a month. Realisticly I dont think it will happen. In two months, it certainly could. For September my estimate is around $8-9K.


http://www.FlippyCoin.com is the #1 Cryptocurrency Exchange!
I agree re: Bitcoin !
Any particular Stochastics? That will probably be #4 on my TA blog series... what market sentiments do you use?
I have been paying attention to prices using the #Coinbase app and have noticed a trend. Whenever #Bitcoin is nearing a new milestone there is a hesitation in the market. More often than not, this hesitation has been met with a drop in the value as people sell off. I figure these are people that got in at an earlier time, feel the current return is good enough, and sell off. Maybe they fuel the jump that often follows?
After this drop there is often a surge in value and Bitcoin jumps well passed the previous milestone, on its way to a new one.
Anyone else notice that?
Me personally, I think the value of Bitcoin is only going to go up over the long term. If you are day trading to earn then you need ever increasing amounts of money to make a decent enough return since the value is so high.
I remember when Bitcoin was $50 a coin. lol Rather interesting seeing it around $5,000 now.
Yes that's effectively what happens around resistance levels. Milestones may be psychological resistance levels. People may have common and similar milestone targets that they all want to sell at (every 1,000, 5,000, 10,000 etc..) ..there is a sell off until more new buyers come in and have an opposite reaction of seeing BTC hit a milestone target and not wanting to continue to miss out.
Yes trading is difficult and it's probably better to just be a very long term holder. I'm sure many people who got BTC when they were 5 cents sold them off when they were over a dollar and even more sold when they were tens of dollars .. it's probably better for people to forget they even have Bitcoin on their computer and remember years later.
I think that is very sound advice. Cannot underestimate some understanding of human psychology.
Your second part is exactly what I did with my first bit of Bitcoin. I got it at about $50 and sold when it first hit the $1,000+ range - I was able to catch it at about $950 as it came down. I have that paperwork I wrote for that Bitcoin framed in my office as my most valuable to date work. lol A reminder of sorts.
Now my wife and me put money in Bitcoin as a "last chance" rainy day fund. This has only bit us once in several years where Bitcoin had dropped from about $2,300 to $,1900 at a time we needed it. Those are some great odds in my opinion.
Now we simply forget we have it until we need it. My shift card stays hidden out of sight and only comes out when we need it.
Great job HODLing!
Triverse I think bitcoin is truly for long-term. We always never to afraid to buy bitcion at any resistance we know it power of growth after legalising BTC growth is milestone.
And on coindesk btc touched 5000$ which is magnify.
I remember when Bitcoin was flirting with $200 on Coinbase. lol I agree, it is a great long term investment and one I wish I had more money to pump into. Considering where it is going, value wise, it is never too late to get in and ride the wave - just the earlier you get in the wave may be bigger.
I think BTC going to 5000$,now real sale price) may be tomorrow new high?It great opportunity don't lose it, on bitmex you can trade bitcoin contract features a high leverage of up to 100x.Users who have signed up with my affiliate link will receive a 10% fee discount, -0.025% (Maker) 0.075% (Taker).
https://www.bitmex.com/register/HJfZyC
It simple, try it now!
7-8000 by the end of the year
Good post to your sharing video!
Thanks!!
Bitcoin has indeed reached record levels. Needless to say that some are reaping enormous gains, but imagine severe consequences that will inevitably ensue following a significant market correction. After all markets are by their very natures cyclical.
I agree that we'll likely see a significant downturn after a peak like previous cycles. Just trying to speculate what this cycle's peak might be.
Informative
Excellent post @steemrollin, I agree with what you write, it's very interesting, thanks for sharing that information, I follow you, we must support ourselves as a community, I appreciate it if you I would give me a look at my last post and give me your opinion, greetings and success in everything.
LOL you have almost the exact same content as @holl.boll!
Wow I don't understand, why?
reat post , I agree with what you write, it's very interesting, thanks for sharing that information , I follow you, we must support ourselves as a community, I appreciate it if you I would give me a look at my last post and give me your opinion, greetings and success in everything
LOL you have almost the exact same content as @hectorjoachim!
steemrollin it's takes so much time to reached 10000$ and i feel bitcoin is unpredictable.
But thanks to sharing this analysis.