Real Expectations for the Bitcoin Bull
Expect a 0.607% - 1.2% daily growth rate over the next two months if the correction is done.
TLDR: Someone putting $1000 into the market might end up with $1437.78 - $2045.65 in the next two months IF ALL IS WELL. A friend said, if you're putting money into crypto, just pretend you lost it. You can find it waaaay later.
For the following analysis, two assumptions are made
The correction is over. In this case, a correction is defined as a move of bitcoin from it's former highs to a point much closer to the longer term moving average without immediately returning to its shorter term moving average. Note that these moving averages are a personal choice and is different from the general ones used by supposed technical analysts. For that reason, I will not disclose what the averages are but will show you the points in the graph that reflect this corrective move.
We are not entering a bearish market for bitcoin. Considering the current price patterns, this is actually a lofty claim to make since no one can predict the future. Do not be deceived by anyone (including myself) who says a bearish move is not in the agenda over the next few months. However, for this specific analysis, we will assume that the correction is done and the entire cryptocurrency market cap is due for an upward move, no matter how slow.
Now that the assumptions are stated. The purpose of this analysis is to calculate a realistic expectation for bitcoin's daily price growth based on former periods of correction (refer to #1 above for the definition of correction). The recent quintupling of bitcoin from a price of around $4000 at the end of September to almost $20000 by the middle of December may have clouded the judgment of many regarding Bitcoin's price growth.
The methodology is simple. Record the open price of bitcoin the day after the correction point and it's open price 60 days later, find the total growth over that 60 day period, and calculate a compound daily growth rate. Bitfinex exchange prices are used for the analysis. Hopefully this makes your expectations on how quickly your investment will grow more realistic over the coming months. If the performance is better, then rejoice!
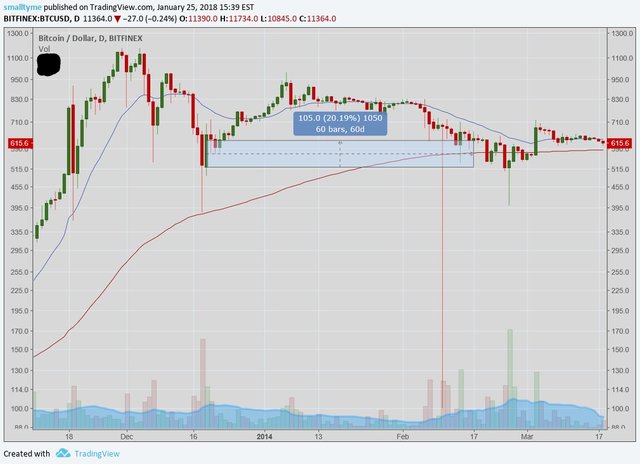
After the price correction in December 2013, Bitcoin opened December 19, 2013 at a price of $520, and 60 days later in February 17, 2014, opened at a price of $625. That's a gain of 20.19% over 60 days. That's a compound daily growth rate of 0.31%. I won't bog you down with the steps of calculation.
Admittedly, after this period of low returns, Bitcoin eventually entered a bear market and did not resume it's definitive upward trend till around October of 2015. I hope that's waking you up to a possibility.
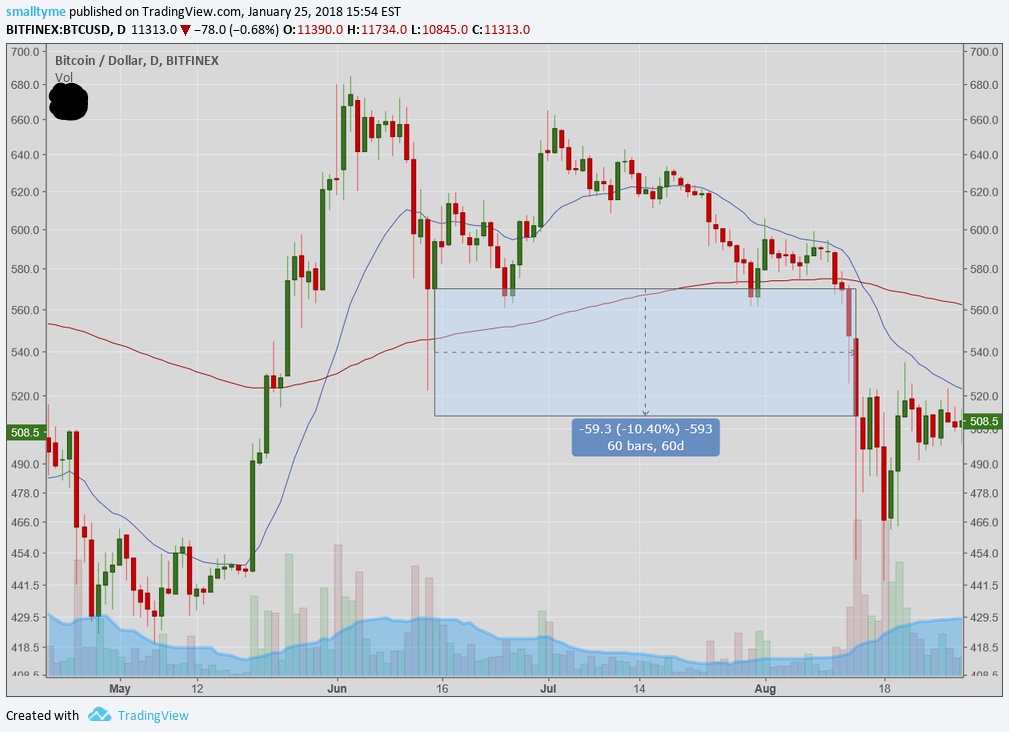
The next identifiable period of correction is in June of 2014. Even though, as mentioned a few sentences ago, bitcoin's upward momentum did not truly resume till October of 2015, an observer without knowing the future might assume the June price movement was simply a correction after a surge from around $450 in the middle of May to nearly $700 in just two weeks. As a result, this time period is included in the analysis. Following the correction, bitcoin opened the next day at $511 and 60 days later at $570.3, a -10.40% decline. That's a compound daily growth rate (henceforth CDGR) of -0.18%
For the rest of the post, I will simply state the date and price of the 60 period following the correction, it's total percentage price move, and it's calculated compound daily growth rate.
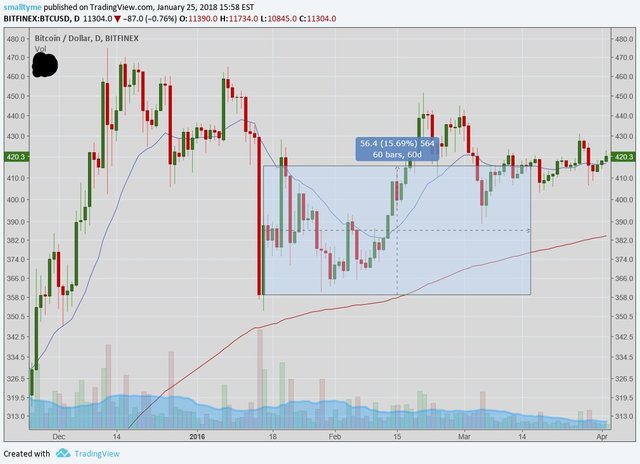
January 16, 2016: $359.2
March 16, 2016: $415.5
Percentage move: 15.69%
CDGR: 0.24%
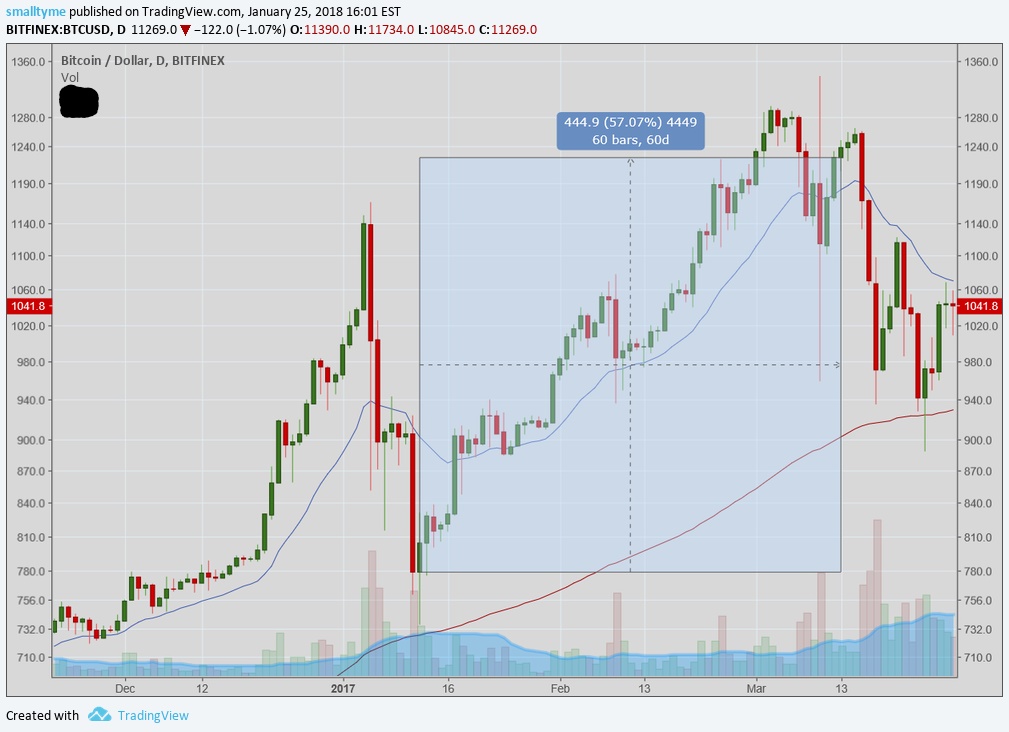
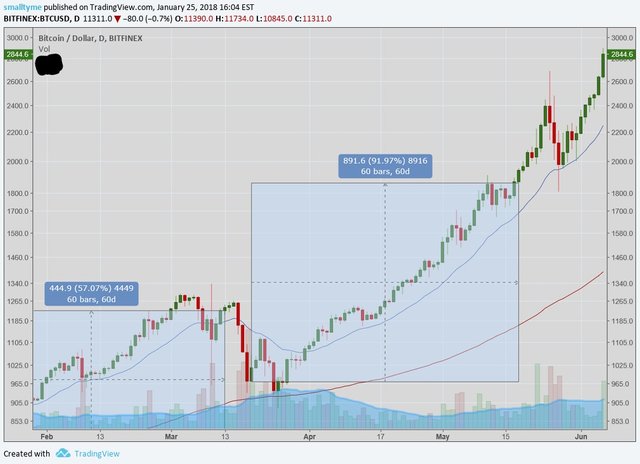
January 12, 2017: $779.5
March 13, 2017: $1224.4
Percentage move: 57.07%
CDGR: 0.76%
March 19, 2017: $969.4
May 18, 2017: $1861.0
Percentage move: 91.97%
CDGR: 1.09%
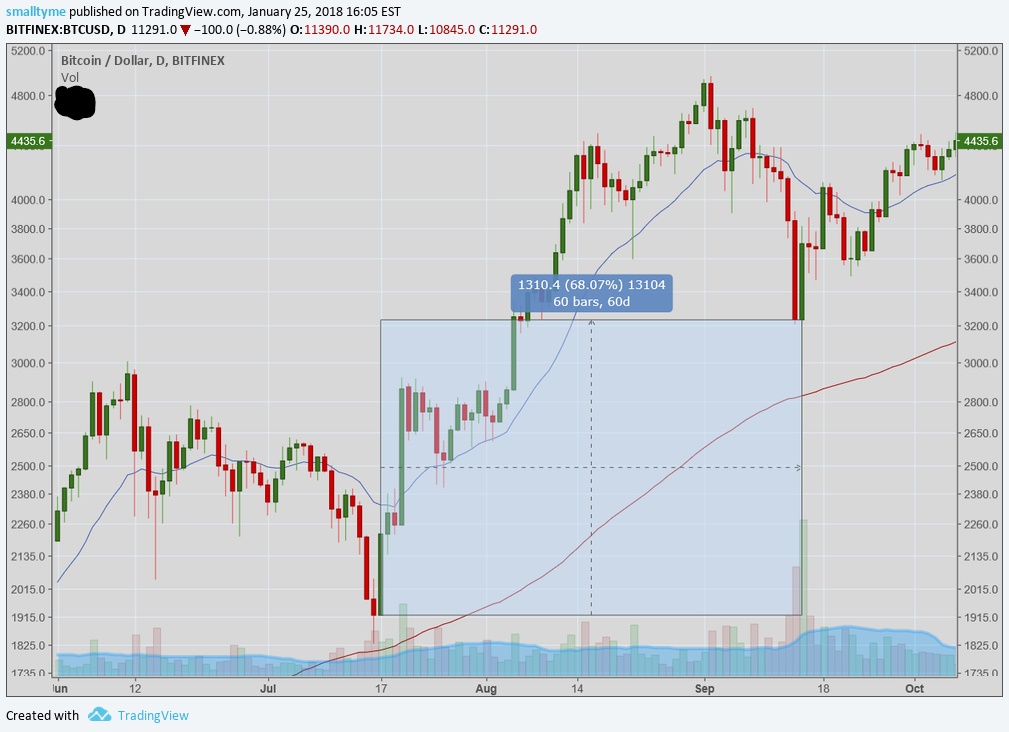
July 17, 2017: $1925.0
September 15, 2017: $3235.4
Percentage move: 68.07%
CDGR: 0.87%
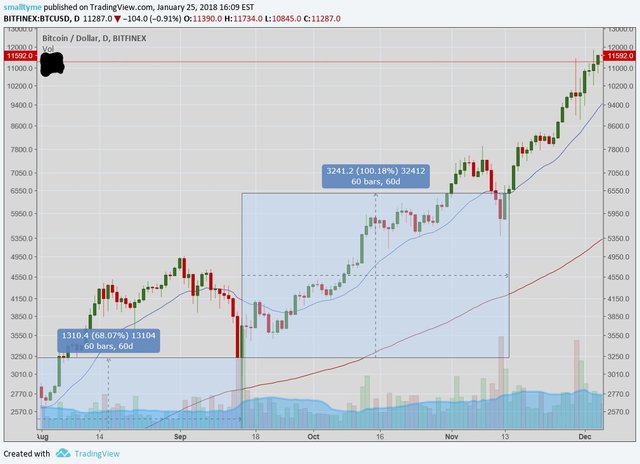
September 15, 2017: $3235.4
November 14, 2017: $6476.6
Percentage move: 100.18%
CDGR: 1.16%
For the identifiable periods of correction as defined in the beginning of this post, bitcoin's percent compound daily growth rate over the following 60 days has been 0.31, -0.18, 0.24, 0.76, 1.09, 0.87, 1.16. The average of all seven periods is 0.607%
It's interesting to note that the daily rate of growth has been steadily increasing so we could potential see a daily growth of 1.2% (arbitrary number) over the next two months.
What all this essentially means is someone putting $1000 into the market might end up with 1437.78 in 60 days if the lower rate of 0.607% is used and $2045.65 if 1.2% is used.
But keep in mind again that this assumes the bull market we've seen so far will continue.
Pretty solid.. I like it.. I hope it is over but I think there is a high probability of one more lower low before we are out of the woods... We shall see...
https://steemit.com/bitcoin/@pawsdog/1-25-2017-the-market-view-and-trading-outlook