WORLD OF CRYPTONS AND CRYPTONS IN THE WORLD: EXHAUSTIVE STUDY OF THE UNIVERSITY OF CAMBRIDGE
2018 marks the 10th anniversary of the publication of the White Paper signed by Satoshi Nakamoto that described how to create a digital financial instrument and operate it safely with a blockchain. As the cryptocurrency industry began to grow based on this technology, the academic world also showed a growing interest in cryptoactives, which today can be seen in more than 300 publications in refereed journals on that subject.
However, these works tend to be highly specialized, which is why the Global Cryptocurrency Benchmarking Study, carried out by the Cambridge Center for Alternative Finance (CCAF), becomes relevant for the interested public.
This is the first study that systematically investigates the different aspects of cryptocurrencies with data collected from some 150 companies and individuals from different sectors of this industry that include exchange houses, purses, commercial and mining platforms.
MAIN FINDINGS OF THE STUDY
The study, completed in May, found that there were between 2.9 million and 5.8 million unique users of cryptocurrency wallets and more than 2,000 people working full time in the cryptocurrency industry, with the explanation that there were organizations, especially the largest mining companies that did not reveal details about their payrolls.
The rapid rise of bitcoin this year is evident with the total market value of cryptocurrencies reflected in the study at the beginning of April, of 27 billion dollars, and that this Saturday exceeds $ 571 billion.
Although bitcoin has been the dominant cryptoactive since its inception, the study points out that its percentage of ownership has declined in the last two years while the Ethereum has strengthened in percentage terms, as shown in the following graph:
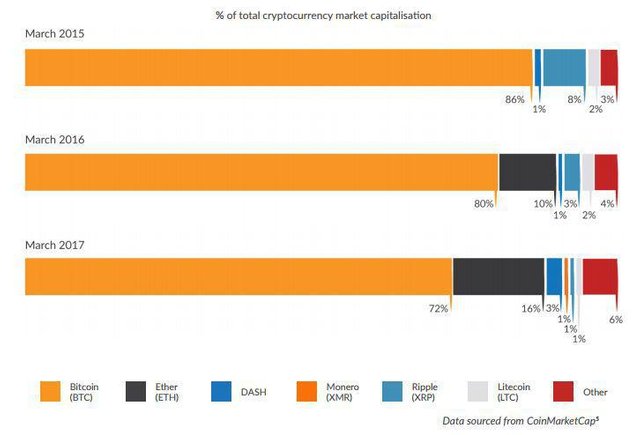
Graph showing the progressive decrease in the dominance of Bitcoin compared to other cryptocurrencies. Photo credit: The Cambridge Center for Alternative Finance (CCAF)
From March 2016 to March 2017, bitcoin goes from 86% to 80% of the total market value, while the Ethereum grew from 10% to 16% in the same period. Neither the authors of the study could foresee that in 8 months the total value of cryptocurrencies would grow 18 times, and it is interesting to observe how the extraordinary boom of bitcoin also results in a deterioration of its percentage weight that is today of 38.5%; Ethereum itself also falls in percentage to 12.08%, which means that the rest of the cryptocurrencies reach a record 50% compared to the two dominant ones, according to CoinMarketCap.
HOUSES OF EXCHANGE
At the date of publication of the study, the CoinMarketCap website registered 138 exchange bureaus, a number that now stands at 174.
Exchange houses dominate the sample selected for the study, both by the number of participating organizations and by the staff employed. The differences in scale in this sector influence the behavior of organizations in this sector. 52% of small exchange houses have a government license to operate, while in large exchange houses that percentage is reduced to 35%, says the study.
Europe, as seen in the graph on the left, is the region with the most exchange houses, (37%) followed by Asia-Pacific (27%). Latin America reaches fourth place with 14%, behind North America.
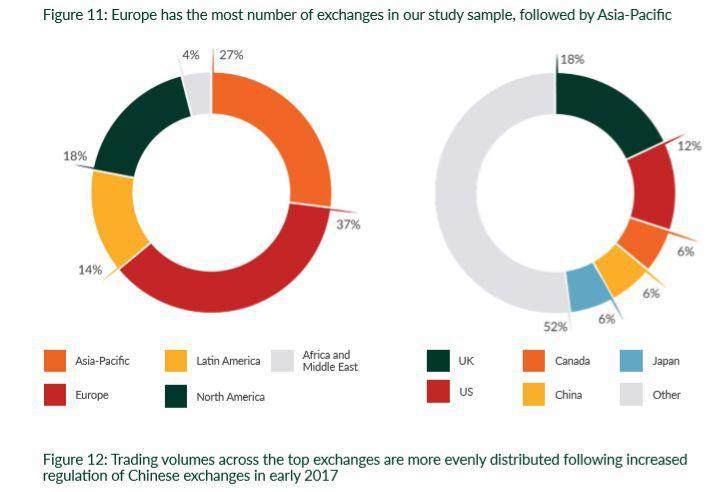
Europe wins number of cryptocurrency exchange houses, photo credit: The Cambridge Center for Alternative Finance (CCAF)
In terms of security measures, the use of external security providers is present in 80% of large exchange houses and in 69% of small ones. The frequency of security audits also varies among exchange houses; the larger ones perform more audits systematically than the smaller ones.
73% of exchange houses control users' funds as they control private keys, while users control those keys in 13% of those organizations.
In terms of the volume of transactions in the different currencies, the US dollar is the most used currency, followed by the euro and the pound sterling. The Chinese Yuan, which dominated significantly the commercial exchange of bitcoin from 2014 to 2016, decreased markedly earlier this year after the strict regulations imposed by the People's Bank in China.
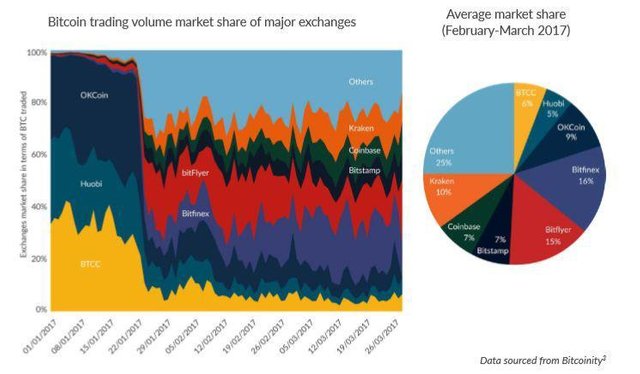
Exchange rates per exchange house. Photo credit: The Cambridge Center for Alternative Finance (CCAF)
COINS
Between 5.8 million and 11.5 million cryptocurrency purses are currently active, 61% of which are in North America and Europe. If suppliers of purses are considered, in those two regions there are 81% of them.
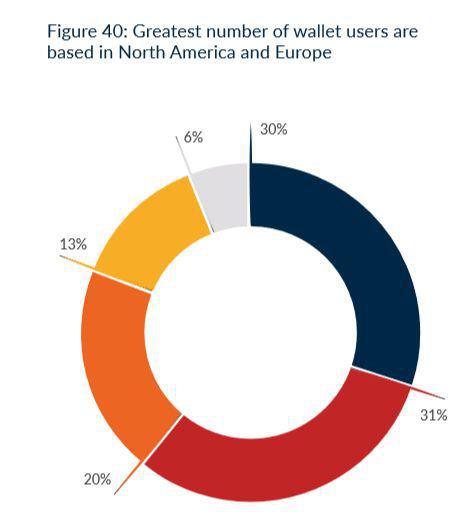
The largest number of suppliers of cryptocurrency purses is concentrated between the United States and Europe. Photo credit: The Cambridge Center for Alternative Finance (CCAF)
Latin America follows Asia Pacific in number of active wallets, with 13% of the total.
In contrast to the Exchange Houses, which mostly control the private keys of the funds, 73% of the purses do not have access to private keys - which are in the hands of the users. Only in 12% of these wallets can users decide whether or not they have complete control of their private keys.
Mobile wallets represent the most used format, followed by PC software and web-based software. Another finding of this study places the percentage of purses with software closed at 32%, which means that open source purses cover more than two thirds of the total.
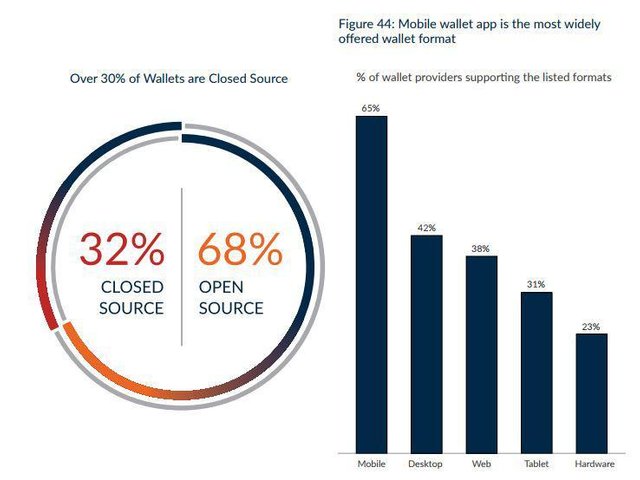
Mobile wallets are the most used format. Photo credit: The Cambridge Center for Alternative Finance (CCAF)
PLATFORMS OF COMMERCE
These companies generally act as intermediaries between the users of blockchain-based value transfer systems and the economy in the broadest sense, which bridges national currencies with cryptocurrency.
The study distinguishes four types of commercial platforms: those that provide transfer services and those that are made from business to business, both focused on national currencies; and those focused on cryptocurrencies: commercial services that process payments for entities that accept cryptocurrencies and general-purpose cryptocurrency platforms that allow transfers using cryptocurrencies or national currencies. In general, in the latter, payments are made in cryptocurrencies but can be exchanged for national currencies.
The following graph shows the geographical distribution of transactions highlighting the percentage of service providers related to the use of cryptocurrencies. The total of Asia Pacific suppliers represents one third of the total and another third of them is in Europe. The United Kingdom and the USA they lead with 15% of payment service providers each.
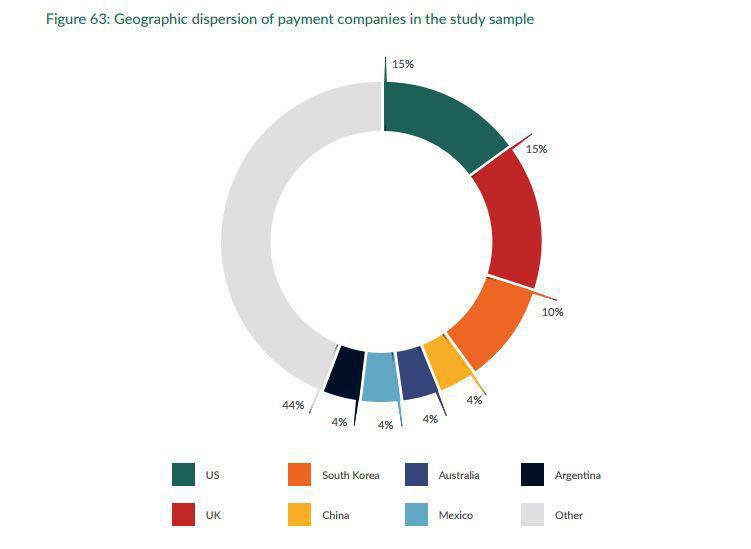
Scatter chart of payment companies in the world. Photo credit: The Cambridge Center for Alternative Finance (CCAF)
52% of the companies participating in the study provide commercial services, while 19% offer a wider platform that allows users to buy, sell and store cryptocurrencies. It is good to point out that more than half of the commercial platforms also operate as exchange houses and specifically within the companies that offer commercial services they operate a house of exchange.
A significant relationship between the geographic location of commercial platform providers and their customers can be seen in the following graphs. In the case of Latin America and Asia Pacific, suppliers predominantly serve local clients, 90% and 76% respectively. On the other hand, suppliers in North America and Europe have a significant percentage of customers than in other regions.
MINING
The mining sector has evolved in a short time from a hobby activity, carried out by individuals in PCs, to a capital-intensive industry with its own value chain, represented in the following figure.
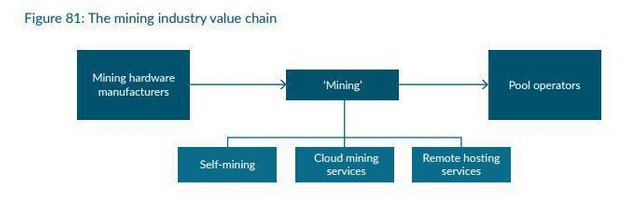
Value chain of the mining industry. Photo credit: The Cambridge Center for Alternative Finance (CCAF)
A small group of large hardware manufacturers provides the industry with the newest and most efficient equipment, while cloud mining and remote hosting services offer their clients the possibility to participate in the mining process without them having to get involved in the operation of the equipment. Large mining organizations and individuals point their power of "hashing" towards mining groups to increase the probability and frequency of finding new blocks and more profits.
70% of large mining companies measure their influence on the development of the blockchain protocol as high or very high, compared to 51% of small or medium-sized miners. 82% of large mining companies carry out multiple activities related to the value chain (operators of mining groups, hardware manufacturers, etc.)
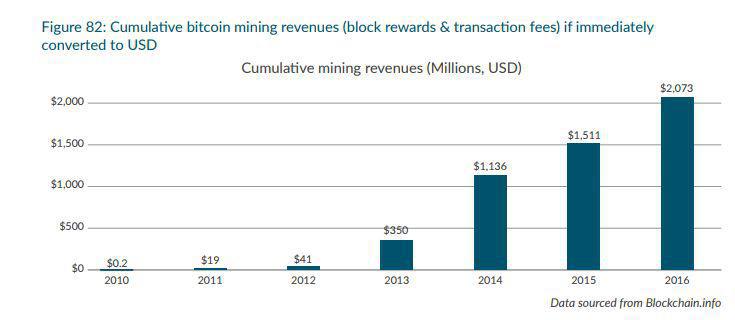
Accumulated mining profits if the bitcoins are changed to dollars immediately. Photo credit: The Cambridge Center for Alternative Finance (CCAF)
The previous figure shows the estimated income of the miners until 2016, which exceeded 2 billion dollars for that year.
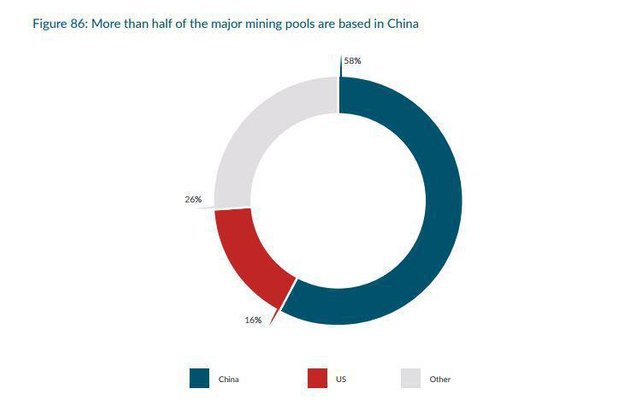
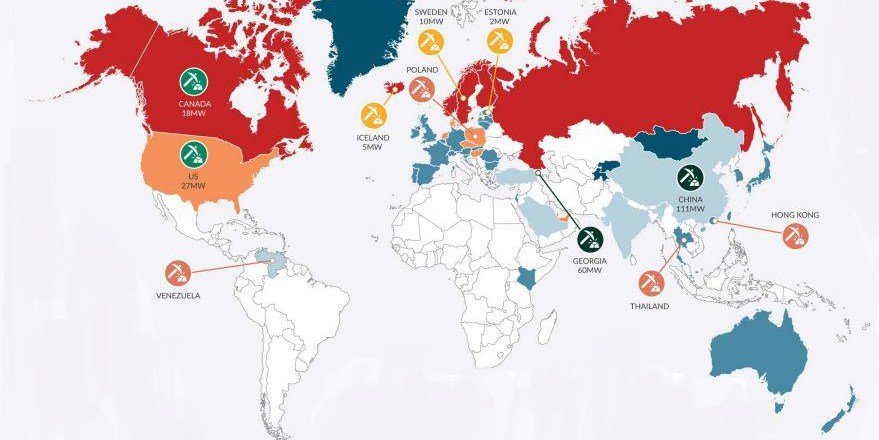
More than half of the mining groups are established in China. Photo credit: The Cambridge Center for Alternative Finance (CCAF)
Almost three quarters of large mining pools (those with more than 1% of the total bitcoin hashrate) are in China (58%) and the United States (16%). All of them offer an English version of their website and 63% have two or more languages available.
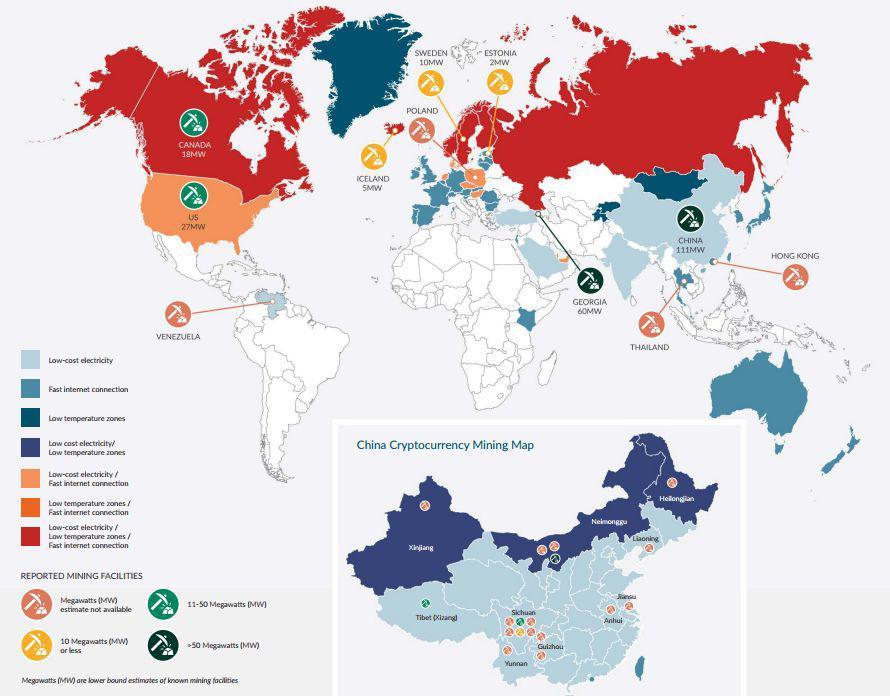
The choice of an area for the establishment of a mining organization depends on three factors: Access to cheap electricity, high-speed Internet connections to receive and disseminate data to and from other nodes and prevent mining equipment from overheating . As can be seen in the following map, the US, northern and eastern Europe and China host more mining organizations and use the largest amounts of electricity. Venezuela appears indicated, but without data of the electrical consumption.
The small miners are concerned about their operating costs that will not compensate the bitcoin rewards per created block, which will decrease in the long term. However, the reduction of the reward of 25 bitcoins to 12.5 in July 2016 did not prevent the total income of the miners from growing this year compared to 2015.
The stricter regulations that create barriers to mining, as well as the creation of taxes on profits, are considered the greatest risks by small and fair miners.
The vast majority of miners believe that cryptocurrencies should be exempt from VAT.
Featured Image: The Cambridge Center for Alternative Finance
@originalworks
The @OriginalWorks bot has determined this post by @rusinho027 to be original material and upvoted it!
To call @OriginalWorks, simply reply to any post with @originalworks or !originalworks in your message!
https://www.criptonoticias.com/educacion/mundo-criptomonedas-criptomonedas-mundo-exhaustivo-estudio-universidad-cambridge/
Congratulations @rusinho027! You have completed some achievement on Steemit and have been rewarded with new badge(s) :
Click on any badge to view your own Board of Honor on SteemitBoard.
For more information about SteemitBoard, click here
If you no longer want to receive notifications, reply to this comment with the word
STOP