Bitcoin (BTC) Technical Analysis 2/15/18 | Elliot Wave + Fibonacci + RSI + StochRSI + MACD + Ichimoku
Bitcoin (BTC) may truly be uptrending now, meaning the real bottom for this cycle was possibly hit at 6K USD, corresponding to the wave 5 peak of the downtrending impulse wave (see blue numbers 1-5 and red letters a-b-c) that followed the 19K high in 2017. On 2/14/18, BTC broke the $9300-9400 critical resistance level that corresponds to the 0.382 Fibonacci line, which is a big milestone since it was previously getting rejected by resistance levels below 9K in past weeks. You can also see that RSI, stochRSI, and MACD are now all bullish and congruent / matching (not divergent) with the new uptrending price action that started after the 6K dip and just broke through 9K, suggesting this is a true uptrend now, and the real bottom was hit at 6K. Ichimoku analysis further suggests this (yellow circles, best viewed in zoomed image below). All 5 Ichimoku indicators are bullish now, unlike before, and it's the first time this has happened on macroscopic / zoomed out charts (6H/12H/1D) since the downtrend began after the 19K peak.
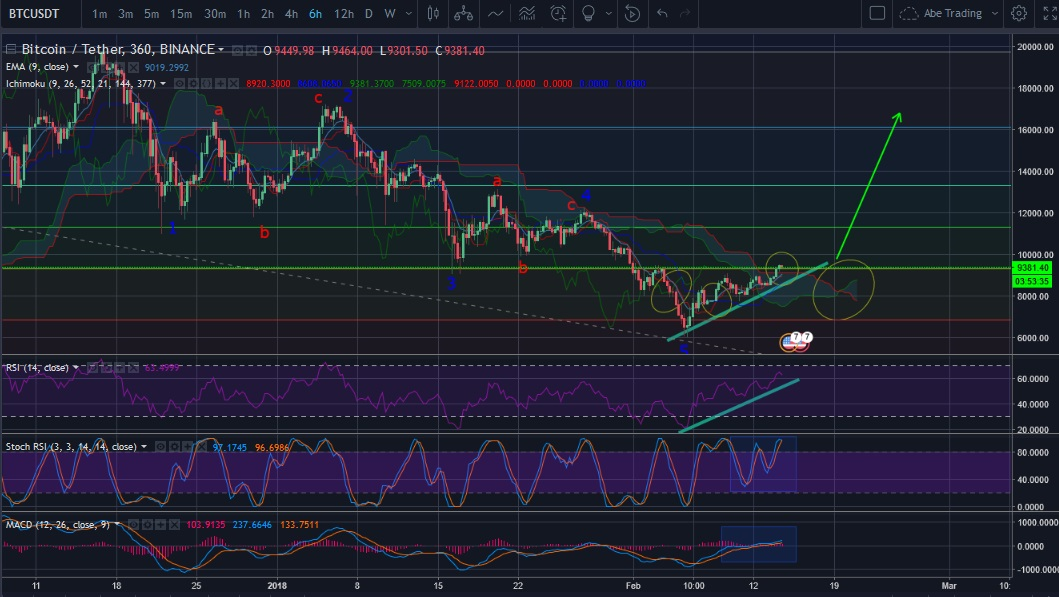
All these things together suggest the downtrending impulse wave finished peaking / hitting bottom at 6K, that the trend has now reversed and is truly upward, and we are now on a steady uptrend even though it will hit a lot of resistance on the way up. Of course, real world events, like Wall St. whales, could come along and crush this uptrend and send us to a lower low, but all the TA indicators I use suggest this is now a true uptrend and Bitcoin hit bottom for this wave cycle at 6K. I have seen a lot of conflicting TA analyses, some suggesting BTC will fall below 6K, and others suggesting we are now on a true uptrend, so I looked into it for myself and wanted to share my findings with all of you for discussion. Obviously I could be wrong, and I'm not an expert by any means, but the available evidence truly suggests to me that Bitcoin hit the bottom of the post-19K peak correction cycle at 6K, and is now on a slow-but-steady, true upward trend, even though it will hit a lot of resistance on the way back up.
Zoomed recent data to better show indicators and drawings
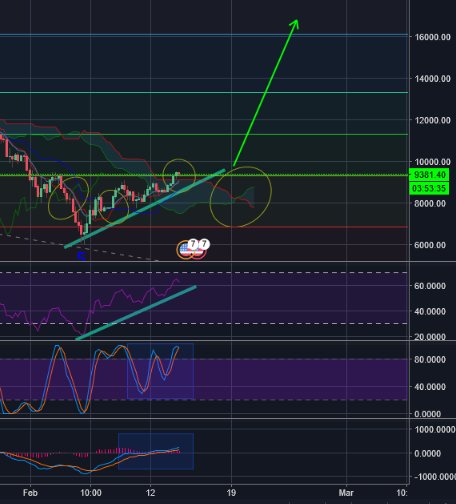
When BTC got rejected by the 10K resistance line on the morning of 2/15/18, it bounced upwards off the $9300 support line, meaning $9300 is now a support line, even though it was previously a resistance line. The $9300 USD line corresponds to the 0.382 Fibonacci line, so this is a very key point, especially now that it is acting as a support line instead of a resistance line. BTC now just broke through the 10K resistance line, suggesting that the bull market really has returned, this truly is an upward trend, and the bottom really was 6K. I could be wrong, but evidence is mounting that my TA was accurate. Time will tell. Just wanted to share the evidence.
DISCLAIMER: This is not investment advice. This is my own personal opinion and analysis, which I use to make evidence-based market decisions. Although this is market evidence that I personally use, this is just sharing my own personal decision making with all of you, without advising you to do anything with it. Invest at your own risk. Never invest more than you can afford to lose. Wishing you all success and happiness!
Bitcoin | BTC | #BTC | $BTC