2/18/2018 The Market View and Trading Outlook
A somewhat pivotal few hours or days of BTC price action is currently underway. In a bullish scenario, price breached the longer term 77 period moving average on the 12 hour time frame at $10,504 on February 16th and fell back to test it for support. In a more bearish scenario the bounce from $6000 was just that; a bounce upwards in a longer term downwards trend. At current critical price levels are $9800 (the two hour 77) and $8800 (the 6 hour 77 period moving average); the latter of which we have yet to come back and test since breaking above.
Let’s get to the charts
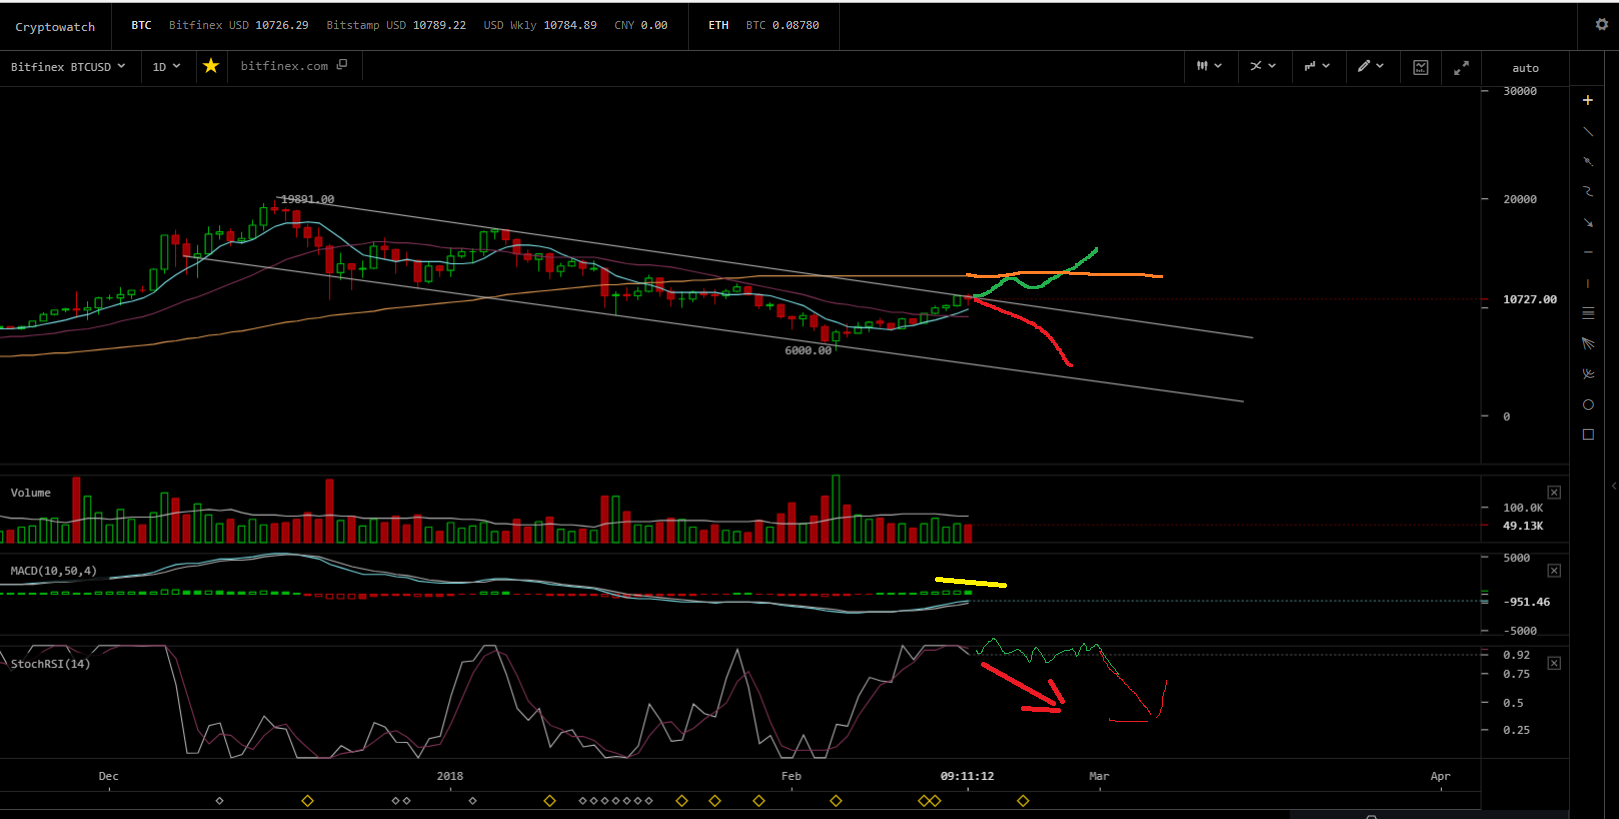
Starting with the daily chart so as to get the bigger picture. Although the recovery that started at $6000 and appeared to end the correction seems good we have yet to break out of the descending channel that started with the decline at $19,900. The rejection of price at $11,200 last night would correspond with the upper boundary of that channel. Accordingly we need a decisive break above towards $12,800 (the 1 Day 77 period moving average to effectively begin nullifying that pattern. If we are unable to break above and price begins to once more descend within this channel the “potential” next devastating low could be in the $4000 range. Indicators that are going to play against us making higher highs are that we are still below the MACD 0 line, which always provides significant resistance or support depending upon which side price is on. That said there is still room to go up before we hit the 0 line which could put us “hopefully” at the 1 day 77 period moving average above $12,000. In which case we could correct back to the top of the channel for support, stall for a bit and move onward and upwards from there.
We also have our first solid bar in a decreasing MACD Histogram which is indicative of a potentially cooling buying period. Lastly RSI appears to be making a retreat from over bought territory. In regards to the RSI it is still above .80 so a full on sell is not in effect as of yet and we have only been in overbought territory for a short while, so there may be a bit of gas left in the tank to the upside based solely on that indicator.
Objective analysis is hit or miss at the moment, there may be a short term gain towards rejection at the daily 77, but most likely we are going to pull back, test support, and trade sideways before making a break one way or the other. I have a slightly bearish short term bias at the moment as regardless of what price does; (we immediately go down from here or break upwards towards rejection at the daily 77) we are going to cross our current price point of $10,650 few more times in both directions before a definitive decision is made.
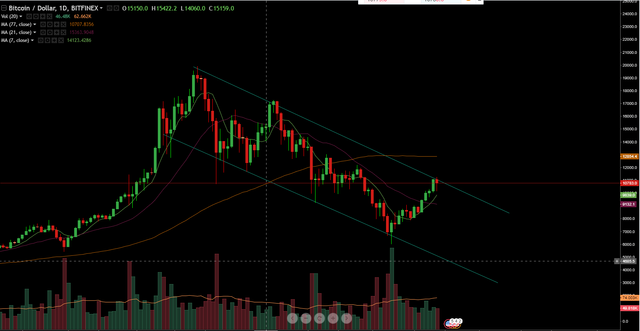
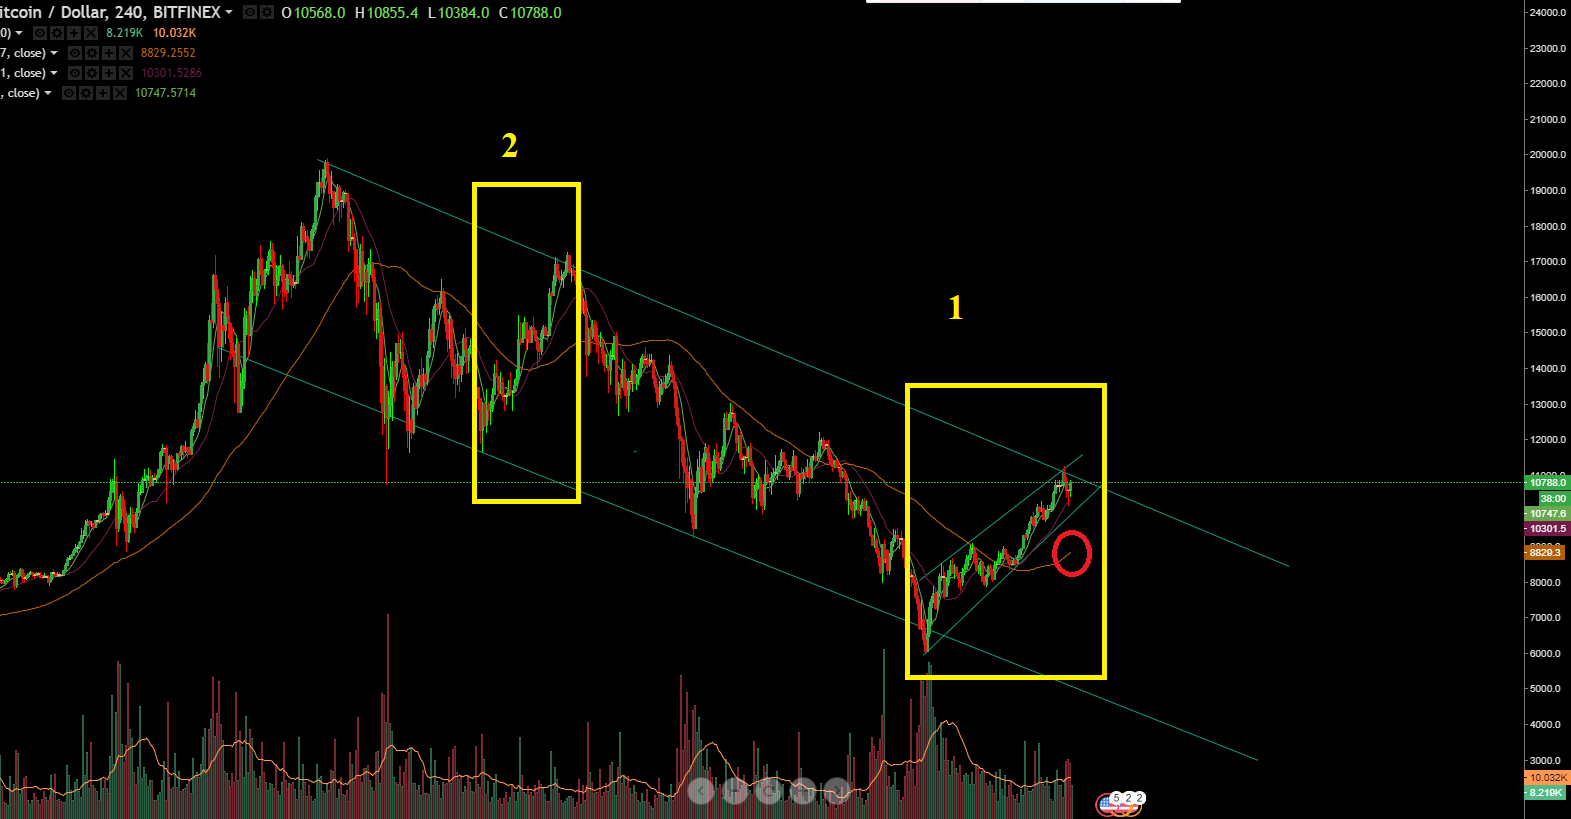
If we look at the 4 hour in trade view we have a very steep upwards channel (1), that again appears to be meeting rejection at the upper boundary of the descending channel. Also as it is so steep meaning the rise in price from $6000 was somewhat fast and potentially unhealthy, it is more indicative of what we saw on the rise from $11,000 to $17,000 (2) and likely to pull back. Ideally in a perfect scenario price should rise gradually and sustainably in a fashion that is less than vertical. This allows moving average support to tail closely behind and continually boost the price up as it appreciates. Quick vertical rises from low low’s to high highs, pull price far from longer term moving averages leaving it with little to no support at these higher levels.
Price will always, always, always, come to meet the moving averages at some point, be it a rejection from below or finding support from above. When you see price pulled well away from longer term moving averages, you know that a reversal, rejection or bounce is the next most likely occurrence. In the chart above note the position of the 4 hour 77 period moving average (red circle) at $8900 and how price has always come back to find it since the drop at $19,800.
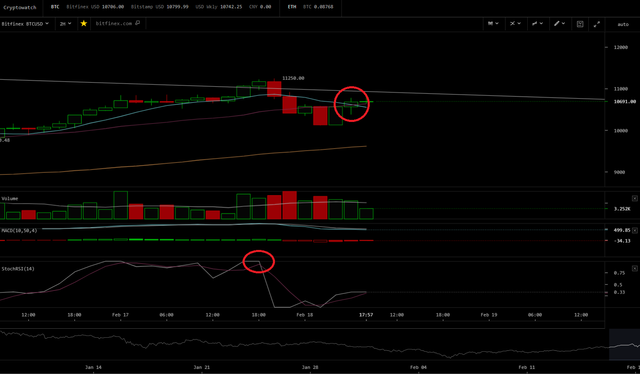
Going into the 2 hour time frame we have a 7/21 downwards moving average cross above the 77, which is usually good for a loss of $400 or more and indicative of a trip down to test the longer term 77 which currently sits at $9612 and most likely will be in the $9770 or better range by the time price comes down. In this most basic trading strategy (moving average crossovers) this is a bearish indicator of a reversal to some degree in the works. We have also just entered oversold on the RSI and price most likely hangs here for a day or so while price declines prior to making a positive break. Buying volume is also not exceeding selling volume over the last few periods. Objective analysis is that price will be pulling back to test the 77 period moving average.
Lastly for Alt Lovers.... Check NBT in times of BTC correction, you may like what you see...
My Previous Analysis:
https://steemit.com/bitcoin/@pawsdog/2-13-2018-the-market-view-and-trading-outlook
https://steemit.com/bitcoin/@pawsdog/2-10-2018-the-market-view-and-trading-outlook
https://steemit.com/bitcoin/@pawsdog/2-7-2018-the-market-view-and-trading-outlook
https://steemit.com/bitcoin/@pawsdog/1-29-2018-the-market-view-and-trading-outlook
https://steemit.com/bitcoin/@pawsdog/1-27-2017-the-market-view-and-trading-outlook
https://steemit.com/bitcoin/@pawsdog/1-26-2017-the-market-view-and-trading-outlook
https://steemit.com/bitcoin/@pawsdog/1-25-2017-the-market-view-and-trading-outlook
https://steemit.com/bitcoin/@pawsdog/1-24-2017-the-market-view-and-trading-outlook
https://steemit.com/bitcoin/@pawsdog/1-23-2017-the-market-view-and-trading-outlook

Alts are still responding quite rapidly to BTC price. Don`t you think if a reversal kicks in one should dump alts as well?
I would, that is why I like NBT as it is a dollar stabilized ALT>
@rocannon best regards from me
thank you for sharing your analysis, I will start to follow you from now on
Thank you..
Some quality analysis! I dont have much to add - I am also a bit short biased, but definitely not certain. A bit of consolidation would be very good for our prediction methods :) thanks for sharing your knowledge with us
No problem, I agree a nice long period of consolidation would be great.. like a week or so around one price...
Yes! This kind of volatility is hard to take advantage of. I like to call it "bad volatility" because its more likely to lose money than to make money :)
I agree.. lol
First, I say thank you @pawsdog already sent to me sbd, I am very grateful.
Bitcoin it is very difficult to guess, you've tried the indicator haikhen aishi ?
I want to learn steemit from you my friend.
Thank you and let us learn together.
thanks you my friend. I want to know how to play steemit for beginners as me ?
quality content and engaging your followers is the key
@pawsdog I'm already resteemed this post.
Thank you
I think this is the first time I feel like I’ve actually learned something and not walked away from someone’s TA thinking they are just making shit up. Good job.
thanks, I try not to make shit up as I trade for a living.. :).. The most basic trading strategy is a moving average crossover strategy.. BTC is unique though as it is heavily manipulated..
thanks for the gift @pawsdog !
No problem here is another.. :)
and who says cats and dogs don't get along :)
They can, I used to have a cat that would ride atop the dog in my avatar... was a good barn cat...
I think Bitcoin will go down for a while to complete a inverted head and shoulders pattern, for more click here @!
Back again after a long period of outdoor activities. We have a week of snowing ahead here in Slovenia. Finally some winter times. Now I will find more time to write some nice posts here on Steemit.
Nice post Upvoted as always!
You may be right.. we will wait and see, finally we have reached the pullback point.
Yeah, weapons prepared!
I am ready.. also fix the link in your first comment...
I edited the broken link.
Some movement at the BTC at the moment of writing. I took some long positions. Intra day experiment!
I hope it goes well
Fantastic analysis. Hopefully, markets can be bullish for all holders of crypto.
Thank yoy. We can hope so but price needs consolidation time to cement gains..
Nice post!Please checkout my page!👍
I will..
@oliveralexander best regards from me, because I'm beginners