1/25/2017 The Market View and Trading Outlook

Today’s’ forecast.. slightly declining prices with a high chance of shit storm in the afternoon hours.
It has been an interesting morning thus far, I woke up, hit the charts early around 5 a.m. EST, noticed a potential pattern, was excited to get it out there in today’s market report and was then informed I have a laboring goat in the barn so I have been dealing with that up till this point.
Moving on, I was actually excited this a.m. as I made the choice yesterday to perform “no BTC trades”. Odd as it may seem, for those that trade often or do it professionally, sometimes you get the most elated when you make the choice to do nothing and that is the right choice.

So what is the pattern I noticed? Well it’s more of a pattern, inside a pattern, inside a pattern; like a matryoshka doll or Russian nesting doll of a pattern. To that end today's report may be short, but let’s get to the charts.
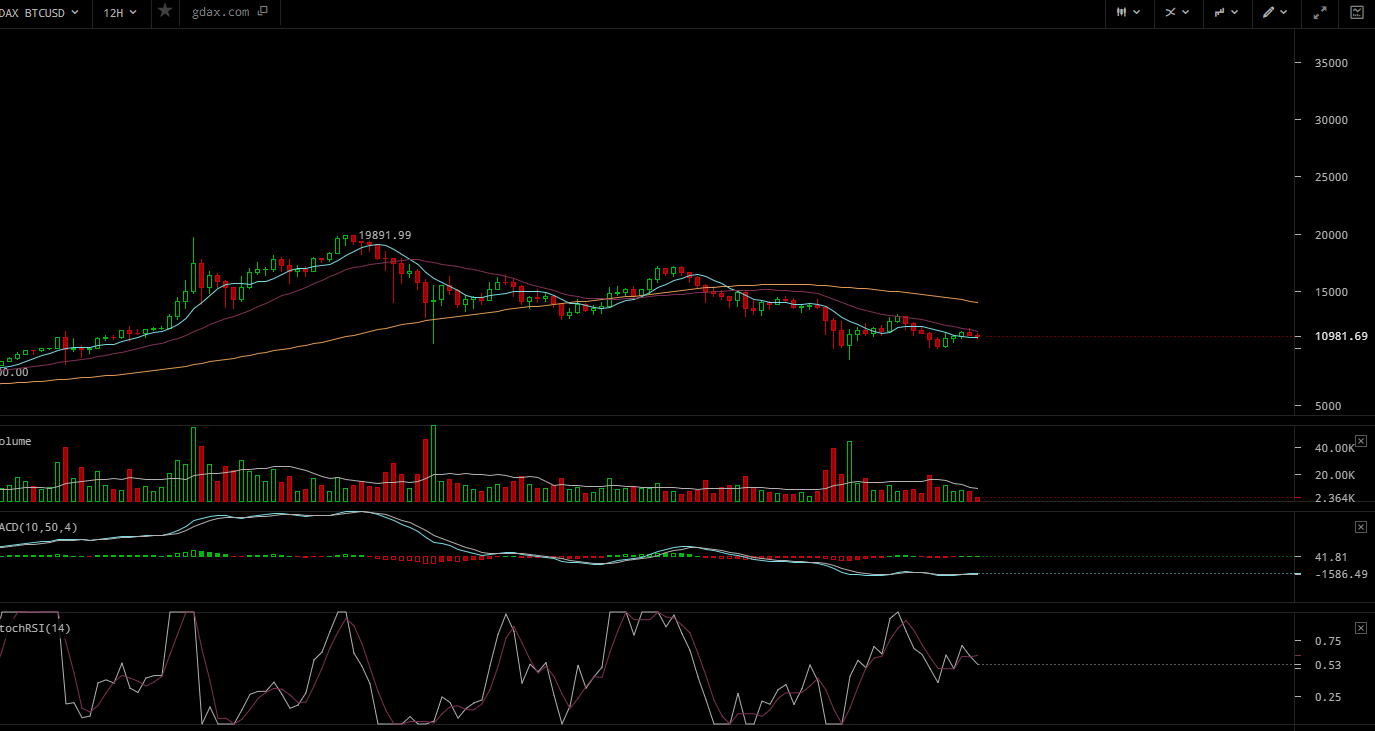
What do you see? Remain objective and always keep your mind open to all possibilities.
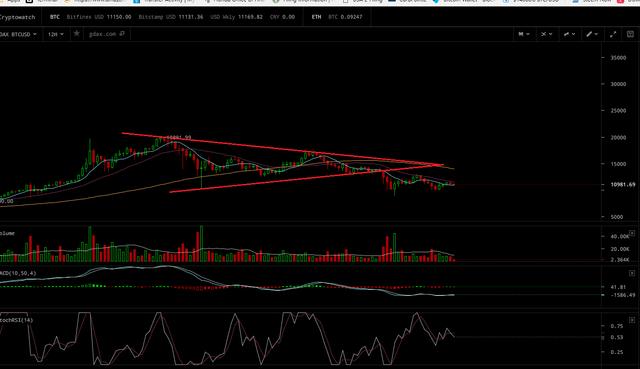
How about now? I have outlined the first busted pattern which was the failed bullish wedge/symmetrical triangle that broke down at $13,000. See anything else?
How about the soon to be busted ascending wedge that followed, broke out made less than a 10% gain and reversed at $13,000 to a low of $9900? But wait theres more…
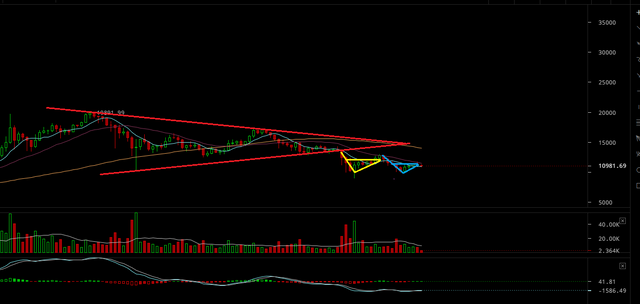
What’s better than one failed ascending wedge? How about two of them; this one barely broke above the ceiling at $11,200, made it to $11,750 and reversed and is potentially heading lower. See anything else?
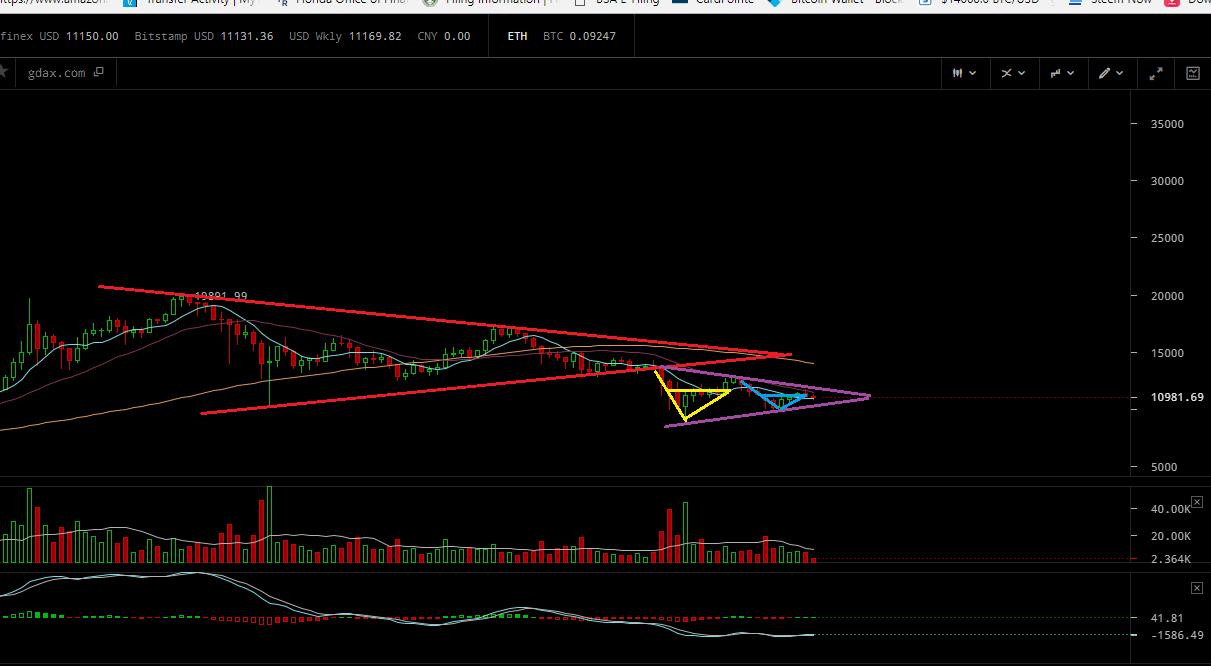
How about another bullish wedge/symmetrical triangle with a floor of $10,136 and ceiling around $11,600.
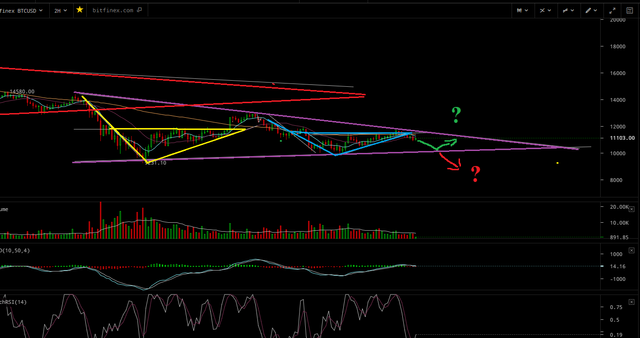
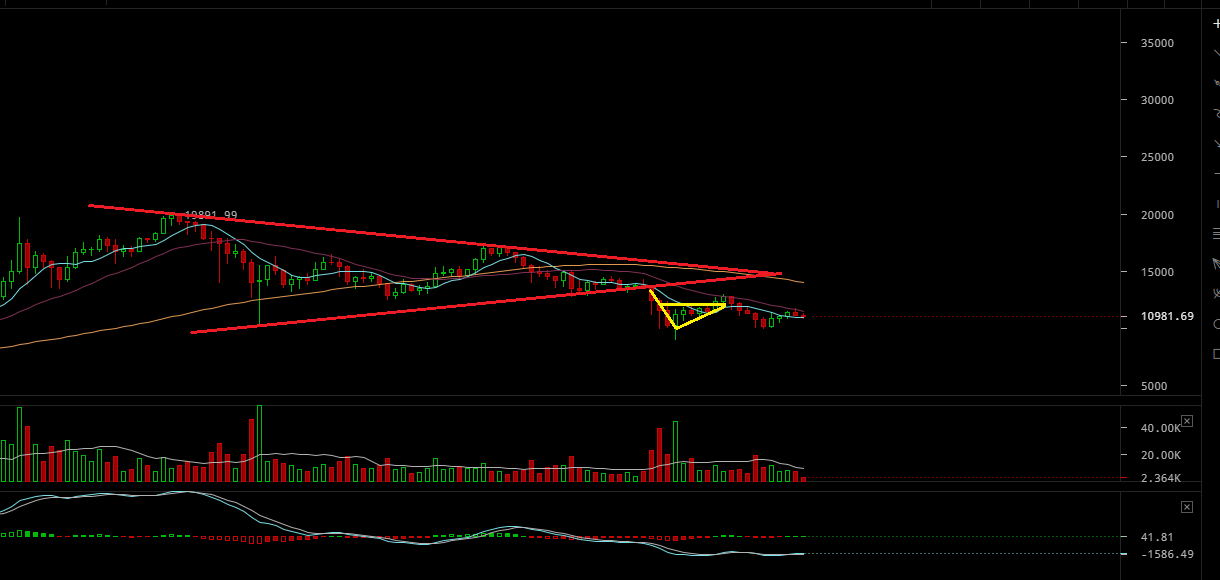
The 2 hour time frame, same pattern just shows up a bit better.
The 2 hour minus the two ascending wedges to show price trending inside the latest symmetrical triangle.
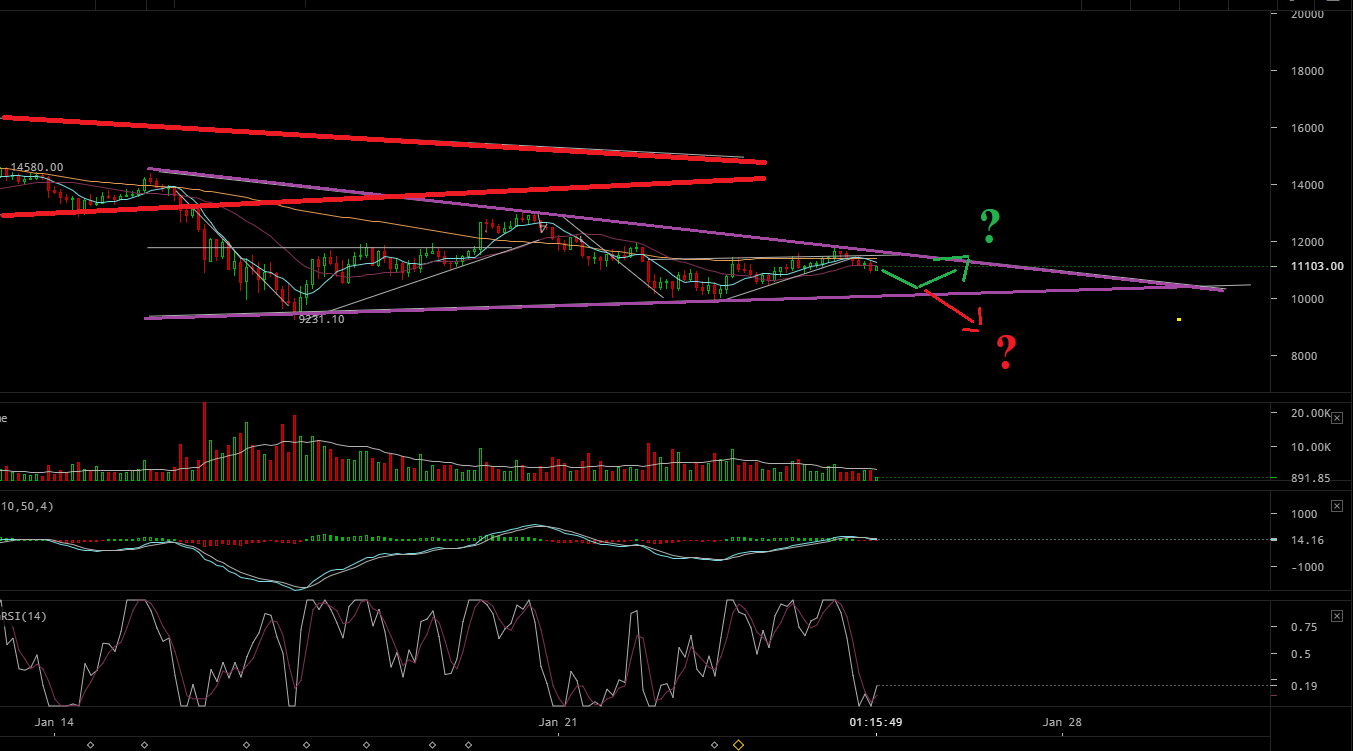
This is where we are now, and most likely trending towards the bottom of the latest symmetrical triangle. The question is; will it break upwards or downwards?
In trying to answer that question I have to look at the indicators I have available and see what if any information they are giving me. To that end, in looking at the MACD we are currently -1493 with a floor of -4000 so we have plenty of free fall area ahead and we are not at absolute MACD bottom. Also as I have stated in the past, I don’t like it when the MACD tries to pull upwards from a point of 40 percent or less below the zero line. Moves from this zone are most often anemic and short lived as they lack true upwards momentum. Also the RSI has given us two selling crosses thus far and is trending slightly south. Volume is also declining notably as is the case with symmetrical triangles and a confirmation of its existence.
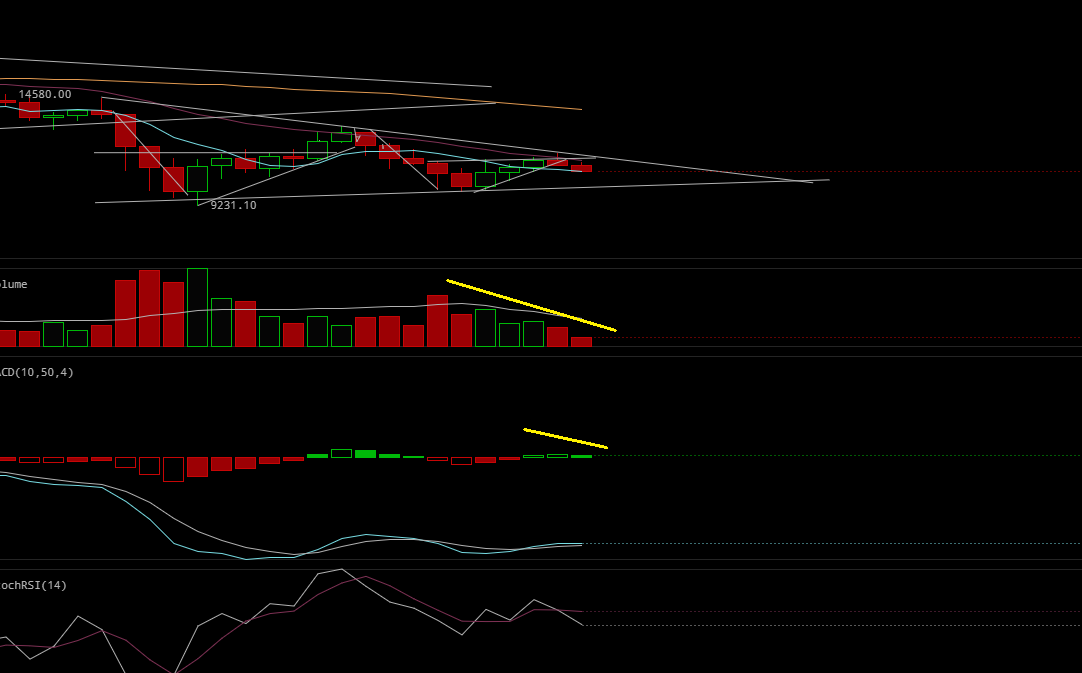
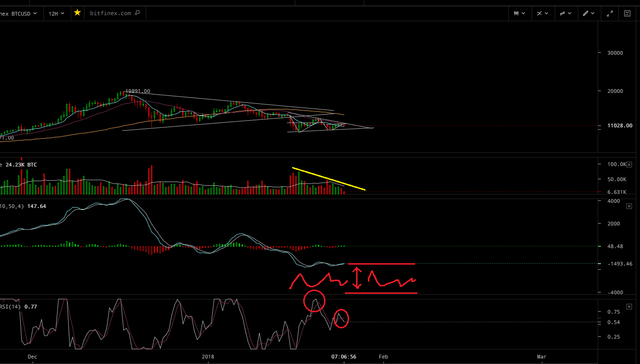
If we pull in closer on the histogram is narrowing down with more and more solid bars, indicative of an anemic buying session on its way out the door.
This also corresponds with what I noted a few days ago when I told you I expected an unenthusiastic buying period in the four and six hour time frames. If the 12 hour histogram goes red, expect a bust of the symmetrical triangle bottom of $10,136 to most likely become a reality. This will also bring a close below $9200; the start point of the first failed ascending triangle. At which point that pattern is a flop and follow on losses below the start point are on average 11 percent as I explained here: https://steemit.com/bitcoin/@pawsdog/1-21-2017-the-market-view-and-trading-outlook excerpt below.
“What we are on the verge of at the moment is a busted ascending triangle. In which case if we close below the start of the triangle at $9236 the average follow on decline is 11 percent which would put us at $8220; this is just an average decline post pattern failure; could be more, could be less. “
Hopefully we break above the top of this current pattern at $11,600 and we are off to the moon, but the volume is lacking and accordingly I think the most probable pathway is South, not North at the moment.
Also on that note, if we go a crashing down, expect another round of Alt Coin losses up to and likely including another Steem selloff as was the case during the most recent severe downswings. Again I could be wrong, but I have to remain objective, not see what I want to see and base my opinions on what historically and statistically happens with both BTC in this particular setup and with ALT coins during a high volume crash.
Sorry if there are typos and it appears tossed together, but I’m in a hurry and gotta head back out to the barn and bring some goat babies into this world… :)
Show the love and resteem, you can be cool if I'm right, and watch me be made fun of if I'm wrong...:)
My Previous Analysis:
https://steemit.com/bitcoin/@pawsdog/1-24-2017-the-market-view-and-trading-outlook
https://steemit.com/bitcoin/@pawsdog/1-23-2017-the-market-view-and-trading-outlook
https://steemit.com/bitcoin/@pawsdog/1-22-2017-the-market-view-and-trading-outlook
https://steemit.com/bitcoin/@pawsdog/1-21-2017-the-market-view-and-trading-outlook
https://steemit.com/bitcoin/@pawsdog/1-20-2017-the-market-view-and-trading-outlook-evening
https://steemit.com/bitcoin/@pawsdog/1-19-2017-the-market-view-and-trading-outlook
https://steemit.com/bitcoin/@pawsdog/1-18-2017-the-market-view-and-trading-outlook

Beep! Beep! This humvee will be patrolling by and assisting new veterans, retirees, and military members here on Steem. @shadow3scalpel will help by upvoting posts from a list of members maintained by @chairborne and responding to any questions replied to this comment.
Whoooooo! Baby goats!!
I do love a tightening pattern... but I love this report for it's step by step play of the indicators, with the gradual inclusion of further indicators to help. I honestly don't know how any traders make money, it all seems so open to interpretation.
I was hoping we'd be back into a bull market after the Weiss ratings, but I guess we'll just have to see. It definitely delivered a much needed shot in the arm.
C+ So not a runner for the Academic decathlon but we will wait and see... I think investors are taking it as both good and bad.. They noted what we already know, slow transaction times and high fees, near inability to upgrade, yet adoption is improving.. Not much in the way of something miraculous and unheard...
As to making money trading?.. It can be tough for sure.. mostly when emotion comes into play.. I tend to do pretty well and accordingly is how I sustain myself... :) Patterns are patterns, indicators are indicators, and no one single one is the indicator of indicators.. You have to take the cumulative total of all available information + experience, overall market direction, historic performance etc and make a decision. Most importantly don't be looking for a home run all the time.. base hits win the game.. You have been following for a while, so you remember my ETH calls, LTC calls etc.. Base hit, Base hit, Base hit.. triple, Base hit.. etc.. Many times I just sit out if I'm not feeling it.. and I cheat as I like to buy with the trend as opposed to using a magic 8 ball and playing pick the bottom.. I'm o.k. jumping on the bus if its going my way..
Ah... if I've learnt anything from you, its that jumping on an upward trend that has volume support is the smartest play there is.... that's not cheating at all.
I do have to wonder if the markets lacklustre form is mostly due to the Korean exchanges no longer being listed on CoinMarketCap. It shouldn't have made any difference whatsoever... but maybe retail investors only like to jump in to a market with a page of green...
True and what makes crypto so interesting is that really all we have is patterns and TA as opposed to Fundamental Analysis.. There are no real earnings reports, quarterly shareholders meetings etc for things like BTC. Now for some of the Alts that may come into play as the coins are basically shares and have an underlying company are business model associated with them. It's tough to play at many times and like I said.. I'm all about catching a ride going my way or seeing an opportunity based on TA that is somewhat obvious like the LTC call a couple weeks ago.. That said I missed the ETH run up before it, but oh well.. I was to busy on BTC charts and there is only so much time in the day. Certain setups present themselves quite often and when I see one I'll go in with a stop and take a risk, but not in a downtrend or bear market.. sideways or bull, sure.. but not playing flip the coin against the bear...
No so subjective and open to interpretation.. hit the top of the triangle and got kicked in the face... and smashed lower on higher volume...
Not out of the woods yet? Even with the Weiss Ratings.
Rhetorical question? Solid C+ for BTc...
Solid
I mean, a C+ average is not failing, likely not going on a field trip for academia to represent your school, but it does keep you on the baseball team.. What are your thoughts in regards to price action... I'm hoping for a break above 11,600 to get us out of here, but just not feeling it as of yet.. There are some big buys coming in, so who knows.. As always we have to wait and see what those with hundreds of millions decide they want to happen with the price...
Needs to be a solid 13,000 to get out of the doldrums.
Part of the low scores are due to the correction. When things start picking up after winter is over, the ratings will probably improve.
I would hope so, there is a TON of resistance above 11,500 at the moment.. I was watching the minute last night around 11,700 and watched a huge buy.. just keep piling on, and being matched by a sell.. he was trying like hell to push it up and it was getting swallowed.. then when he ran out of gas.. a 200 BTC sell in the next minute into the now empty order book, dropped past the buyers open and forced him to sell the 600 or so BTC he just bought to break the wall, forcing price lower.. Someone is keeping us right where they want us for the moment.. Futures are coming due soon, which is the optimum time for BTC price to be at its lowest.. so there may be some interest in pushing us down further again. We shall see but we certainly need some serious volume and price action to reenergize buyers and bring them back to the market.. So many wounded souls right now, that have been punished during this correction it is going to take much to the positive to bring them back in..
Maybe you were onto something about March.. https://www.reuters.com/article/us-tradingtechnologies-coinbase-bitcoin/trading-technologies-coinbase-deal-to-bridge-bitcoin-and-futures-idUSKBN1FE2CK
Check out this
Those gut feelings.
As far as the other discussion with @dragosroua. I swear I had a conversation with someone about creating a bank in Vanuatu and making a cryptocurrency. It had to be after my comment on @dragosroua post, because that was the first seed in my head. I've tried searching Steemit and Twitter to find my comment, but have come up blank.
Very true, sometimes you have to go with them above all else.. that little voice sometimes speaks a lot of truth.. the key is to be receptive towards hearing it..
Sorry for the delay ! I had a busy day at the office with Trumps remarks about TTP. The dollar went crazy, which crashed the WTI and I had some energy stocks, lol. After I came home, I had to think of a good article to write about, which takes a lot of time these days.
Back to your charts - I LOVE what I see. Well charted man, well charted. You are absolutely correcy it's going to be spectacular, the only problem is that with the current volume and mixed signals we can't determine which way it's going. My indicators (MA mainly) show that downward movement is a more likely. I think not much has changed for the last few days. I will be happy whatever happens.
CONGRATS ON GOAT THOSE BABIES ! GIVE US A PHOTO :)
Unable to break the top of the triangle and the volume of the drop is looking more exciting by the moment.. So $10,100 should be the next battle ground before fail... It may recover, but it seems to go down quicker than up and or more volume..
I think that FUD is once again the one to blame - https://cointelegraph.com/news/japan-coincheck-exchange-freezes-all-withdrawals-as-up-to-723-mln-leaves-its-wallet
Maybe.. price makes the news, not the other way around.. BTC is always besieged by negative news after it is already well on its way into a correction.. Go back and check the 5k to 3k drop on the daily chart with MA and MACD and then notice the timing of the Chinese cryto ban, well after the correction had already started.. This is the way it is.. People think that news makes the price but it is really the other way around always is... Same thing here: https://www.express.co.uk/finance/city/909124/Bitcoin-price-news-binance-coin-bitconnect-coinbase-ripple-ethereum-cryptocurrency more bad news that means nothing really..
Yes, you are absolutely right. Maybe I did not express myself correctly. I believe that price action shows the way, but sometimes there is a need of a catalist to accelerate the trend. However BTC showing strenght.
P.S. You wake up at 5'oclock, crazy stuff ! You should share you tactics :D
I get alerts on my phone etc, when price makes a rapid move and I take my job somewhat seriously so I get up and see what is going on, but the drop was pretty dramatic and I fear it may not yet be over..
https://www.reuters.com/article/us-tradingtechnologies-coinbase-bitcoin/trading-technologies-coinbase-deal-to-bridge-bitcoin-and-futures-idUSKBN1FE2CK
This is a very good post and makes me want to study ta more I had to look up some terms like MACD aka moving average but I understood most of it. You got any good book recommendations for learning more advanced ta?
@ervinneb, he has some great book recommendations.. and thank you for your kind words I appreciate it...