BITCOIN:PULL BACK AND THEN 6K?
All eyes on this, to see if it scenario plays out.Looking at the daily chart, we can see that the BTC rose almost to 50 EMA . It approached so much, but today it returned to the down-side without really trying it. Seeing that the market approached 50, but did not try it physically, it tells me one of two things. Number one: the strength of the buy side is still extremely weak, and the price will probably fall back to form a lower minimum. Or, number two: the market is rolling below 50 EMA, forming a potentially bullish pattern, to explode through the 50 EMAs in a break of that pattern. Honestly, there is no way to know at this time. So, as the market moves sideways here, we have to let it show us where it wants to go.
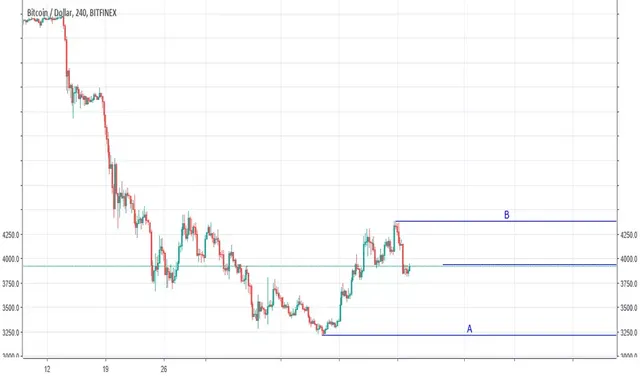
I see the possibility of inverted head and shoulders on the board. Now, I am not saying that an inverted head and shoulders are definitely developing. Rather, I have included it in the graph as a possibility that we should not ignore. It is POSSIBLE that the price is in the process of forming an inverted pattern of head and shoulders below 50 EMA. It is not unusual for markets to form bullish patterns below the significant resistance levels, when the market is at a major turning point. When markets do this, it is as if investors are preparing for a powerful movement through resistance. You can consider it as a spring. Occasionally, the market will attempt to generate explosive energy, such as a compressed spring, with bullish formations below the key resistance. It is much more likely that the market will shoot through the 50 EMA, when it is launched from an inverted head and shoulder break, than just a random test with no energy from the 50.
So, that is a scenario. On the other hand, BTC technically seems to have just printed a higher minimum below 50 EMA. Using history as an indicator, in recent months, a failure around 50 has generally led to lower lows in the market. So, technically, that is the most likely outcome, based on recent historical evidence. we can'tforget that BTC never touched 3000. It came a lot, but in reality it never tested 3K. (, BTC reached a minimum of 3128.89). The pivot support of 11/6/17 is right in 2998.99. It's a critical support that should have been tried, but it never was. Therefore, if BTC breaks below the 3000 range, it could generate some important sales.
By touching the possible inverted pattern of head and shoulders, we can see where the neckline would be . The problem I have with this is that it has a negative slope. In general, inverted head and shoulders patterns with negative slopes tend to be weaker than those with flat or positive slopes. Therefore, it is not the most resistant looking structure, for a possible inverted pattern of head and shoulders. However, the 50 EMAwill soon intersect with the neckline of the (potential) IH & S pattern. The intersection or convergence of these two levels of resistance could produce a powerful break, if the price is able to overcome both at the same time. Therefore, we still can not rule out a recovery of BTC towards 6000. If the price can reappear and complete the right shoulder, then break above 50 EMA and keep it as support, I think BTC will charge higher towards the resistance zone of heavy overload around 6000. You can see that the price broke below it on 11/14/18, it formed a bear flag and never looked back. So, technically, the BTC broke below the main support at level 5777, and never tested it to confirm it as resistance. Therefore, I can see a technical case of why we could go back up to the 6K level.
In the MACD, the momentum is starting to restart, indicating that there are likely to be more disadvantages in the coming days. The RSI also shows that the strength of the buying side has resistance to the blow. These indications align with the possibility that the price falls for a few days and potentially recover to form a right shoulder. On the other hand, the price could fall and try to break it down below 3000. We just do not know until the market can show us more data. For now, let's look carefully, to see if BTC can form a base for the right shoulder. If that happens, we will have a greater chance that this is really an inverted pattern of head and shoulders. Until then, it is best to be short-term neutral in the market in my opinion.

Thank you for using Resteem & Voting Bot @allaz Your post will be min. 10+ resteemed with over 13000+ followers & min. 25+ Upvote Different account (5000+ Steem Power).
I like your post.

MyDiceBot - World #1 Cross-Platform Dicing Bot