Bitcoin Technical Analysis [03.12.18]
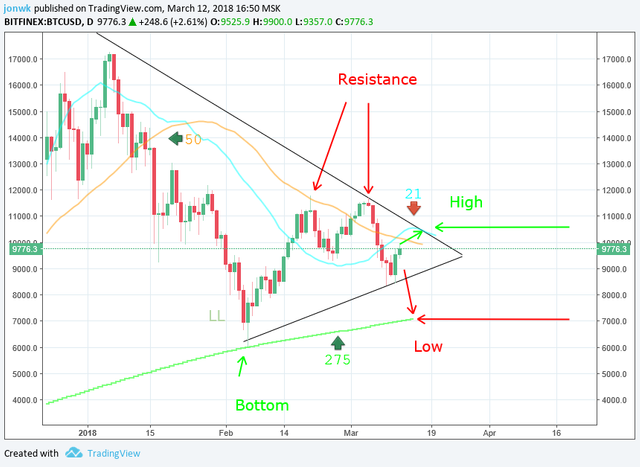
Bitcoin is gaining some strength. The price could go higher and cross the 21 day moving average and then 50 day moving average. If the market is still going bearish then the price could fall down again. The chart shows waiting mode. Investors seem to wait for clear direction whether to sell for cut loss or buy because of fear of missing out. Target H: $10500 L:$7000
NOTE:
- This is not financial advice so please do your own diligent before investing
- Never invest more than you can afford to lose
- Technical Analysis is not pure science
- Market is not something that can be predicted accurately because of the behaviors of investors
Technical analysis employs models and trading rules based on price and volume transformations, such as the relative strength index, moving averages, regressions, inter-market and intra-market price correlations, business cycles, stock market cycles or, classically, through recognition of chart patterns.
In finance, technical analysis is an analysis methodology for forecasting the direction of prices through the study of past market data, primarily price and volume.
https://en.wikipedia.org/wiki/Technical_analysis