How to trade in this Cryptocurrency Volatility? (Homework Assignment #8)
First off I am not a financial advisor. I actually blew up my trading account twice in my life. We are talking about life savings here! So take my post and info with a grain of salt.
So if you are new to trading and want to know when to buy a coin price I will show you a step by step way of buying at a "good" price. I quote "good" because if you have witness how volatile crypto prices have been lately you would understand stand that a lot of times it feels like throwing a dart when picking a price to buy the crypto you want. So are you ready to become a smarter trader and earn big? Lets do an example. Let us review prices of bitcoin to figure out when is it a good time to buy.
If you already are an investor in cryptocurrency you will likely know about the website coinmarketcap. The site lists over 1,500 coins/tokens that are traded around 8,600+ markets. Basically this is the go to site for watching crypto prices. The site is where I will extract charts to use in my example of when to buy bitcoin.
Bam! Chart of one day bitcoin prices.
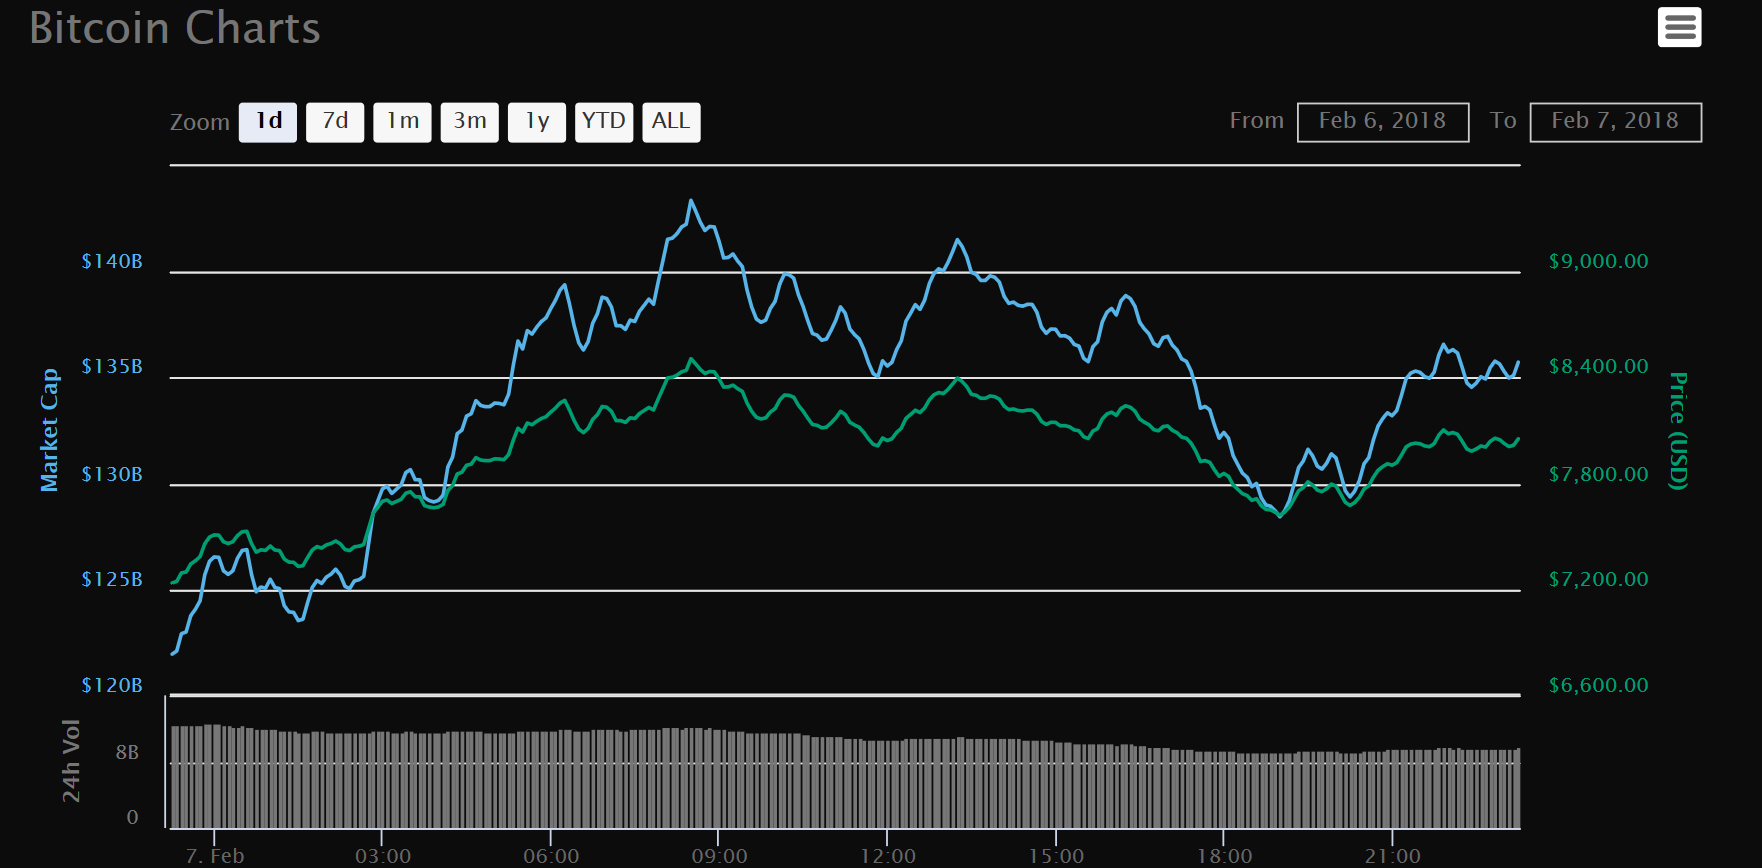
Well look at that. If you been following crypto prices for the past 48 hours you would know that as of now bitcoin is on the rise and recovering from a significant pullback. $7,700 seems to be a decent support level. Support level is where you see buyers stepping in to buy bitcoin at that price level. Pay close attention to this concept. The "good" price to buy is right before your eyes as we move on.
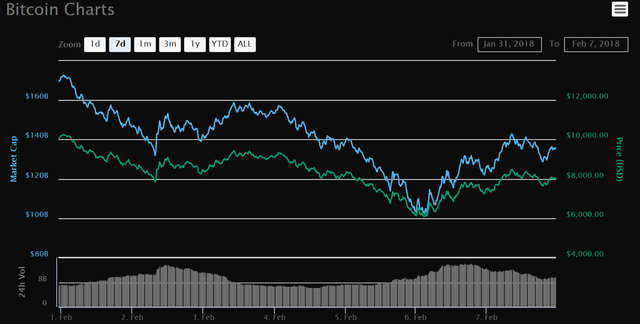
Above chart of 7 day bitcoin price don't look too bad. Although prices have trended lower it seems to have settle right above $8k. You can see the price hitting that $8k line a ton, green line, therefore that price is heavily invested. Interesting is it not?
On a one month chart.
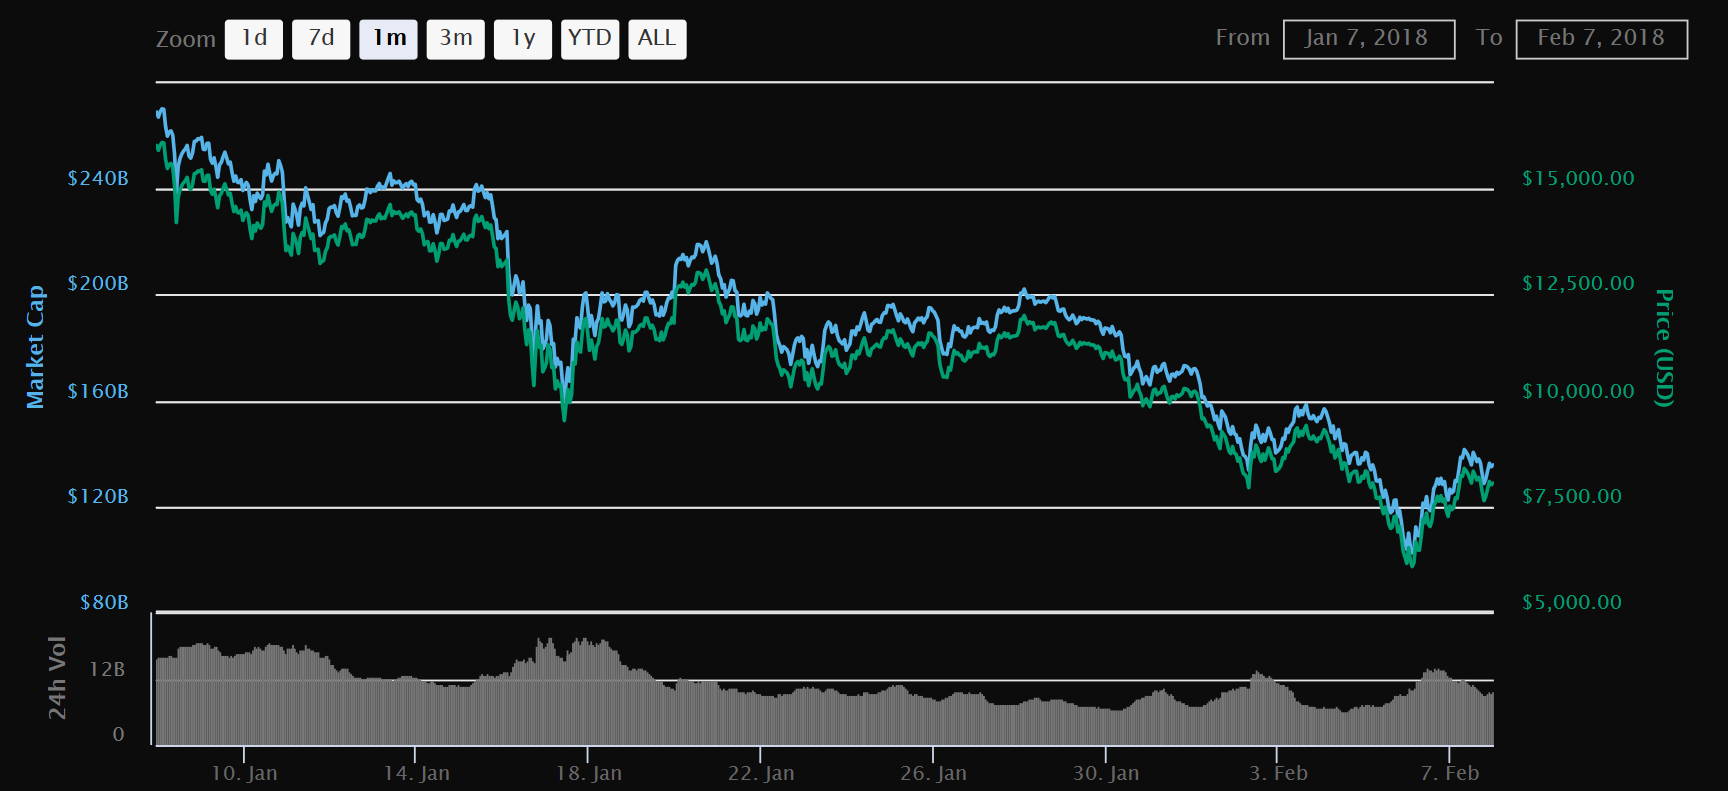
Oh sh*t. Definitely not good to buy at bitcoin just looking at this chart. Bitcoin bounced off of $10k once in that month but has since failed to hold and get back above that price. Even the $8k support we saw on the 7 day chart don't look that strong. Just looking at this one month chart I am simply feeling no confidence in bitcoin rising. Yet lets forge ahead. Don't let a hurdle get in the way to our financial freedom.
The three month chart.
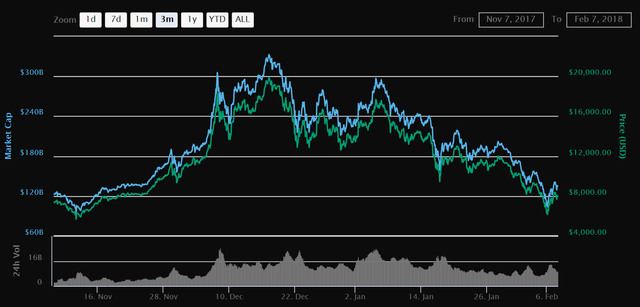
Hhhmmm. So looks like bitcoin prices peaked came in around $20k at mid December 2017 and oh take a look at support level.
Do you see that! Here it is with a clear demarcation.
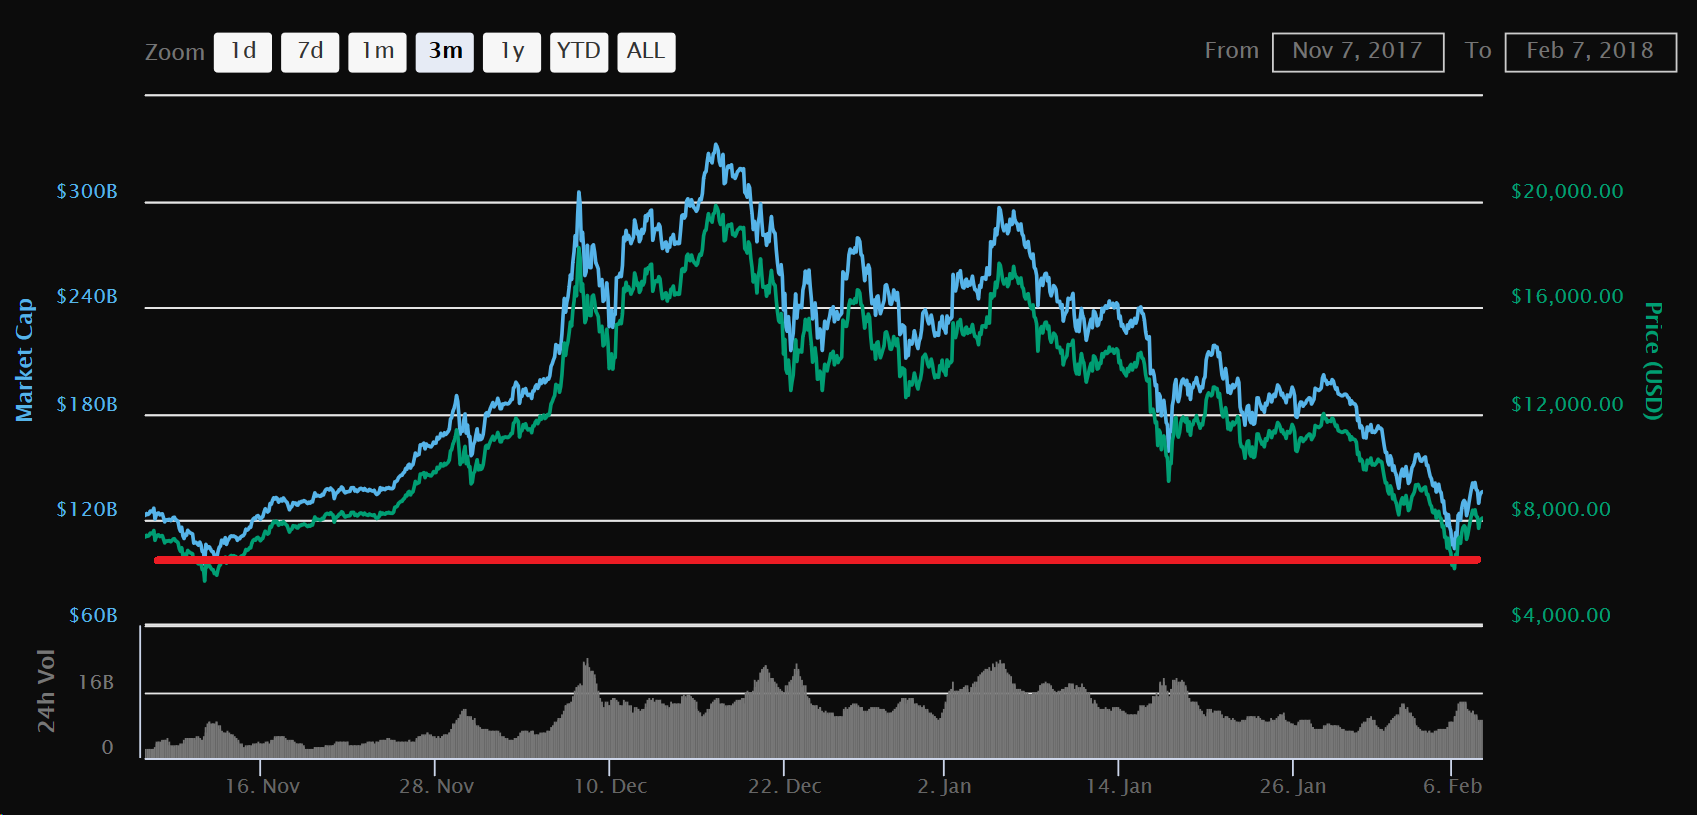
Wham! I just taught you how to read charts through different time frames and understand what a support level is.
If you ever heard of human sentiment on stock trading you can easily find it through price action. The more times prices touch a level the stronger it is as a support or resistance level. By looking at many different time frames one can find where these support and resistance levels are. Fancy traders describe this as "price has memory and only price pays."
If you do not know when to get in on bitcoin a "good" buy would have been around $7k. Reason being is that in the past it was a level where we saw buyers.
You can actually pull charts as far back in time frame as you wish, but I end it at the 3 month to show that it was not totally random that bitcoin prices bounced yesterday. Of course it could be a coincidence that it bounded at around the same level as on the 3 months. Who knows, I just read what the charts tell me.
I conclude when I say "good" price to buy bitcoin is to remind readers bitcoin prices may still have further to drop. Keep an eye around yesterdays bottom for the next few trading sessions. If the prices do not hold you will have to pull longer dated charts to find the next support level. Best of luck and stay safe.
Thanks for reading.