Bitcoin Trend Series / EP. 527 / Stability _ Upside Break Might Be More Likely
Time: 8.27 A.M. / GM+2 / 14th Mar, 2018 – Wed.
In our previous post / 526 / we wrote about "Reverse H&S Pattern & Elliott Wave Theory" and we had forecast the trading range will be between 8.60K and 10.15K, the intraday high was 9.28K, and the low was 8.88K.
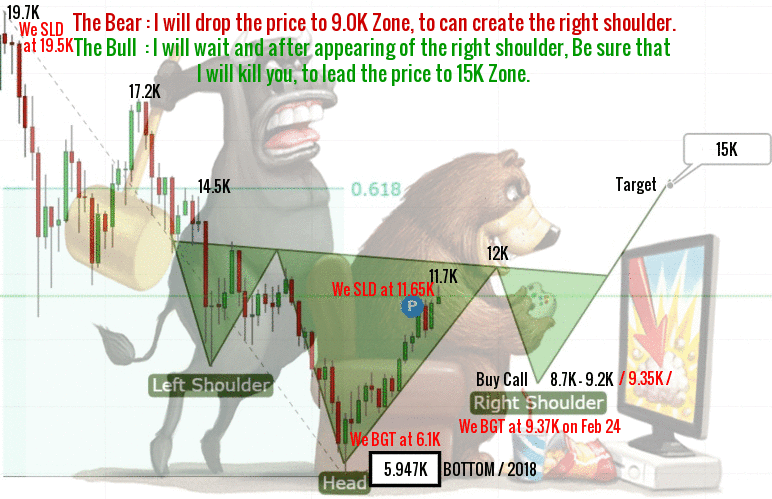
Bitcoin price keep its stability ( consolidation phase ) below 9.675K, under negative pressure coming by the EMA50 and the price needs to get back through 9.322K ( Feb. 26th low ) to can reach 10.150K areas in order to continue the climb.
Bitcoin price trading with crazy stability ( More than USD ) and in the same time has formed lower highs and higher lows, creating a symmetrical triangle pattern on its 1-hour chart, and we waiting for up / down breakouts. The height of this triangle is 1.6K ( spans between 8.4K and 10K ) so 1.6K move is expected in either direction.
My point of view; Breaking 8.4K will be so roughly ( 61.8% retracement level ) because it is an important support. Based on fib retracement, MA100, and Elliot wave, the reason why I think, that a un upside break might be more likely to happen.
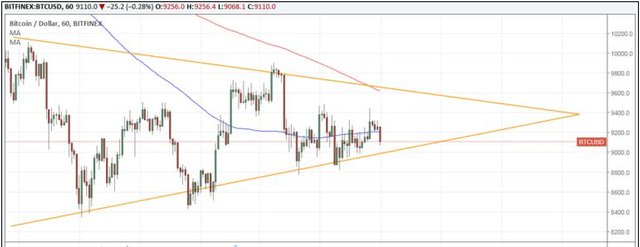
Bitcoin is currently trading around 9.144K at time of writing and the trend is bullish for today, conditioned by stability above 8.4K.
Narrow trading range between 8.7K and 9.7K for today ( consolidation phase ) is expected.
Note:
- If you are trader and you BGT at 8.4K, move your SL to 8.242K.
- If you are investor, HODL.
Support : 8600.00 level (Major).
Resistance : 10150.00 level (Major).
Expected trading for today:
is between 8600.00 support and 10150.00 resistance.
Expected trend for today :
Bullish
Medium Term:
Bullish.
Long Term:
Bullish.
The low of 2018:
5947.00 / IHS Bottom.
The high of 2018:
25000.00 level / Expected.

Thank you for your great informative post.
tnx for upvote
don't know about btc but steem doing fairly well after that :D
This post has received a 12.61 % upvote from @booster thanks to: @lordoftruth.
thanks for the trading notes always helpful for me
perfect buying point you suggested its there :D
8.6 target was easily achieved and climbing up after that
I enjoyed your presentation and appreciate your post. Thank you.