Bitcoin Technical Analysis January 2021 Cycle
Before reading...
As the title says, this technical analysis is pretty late. Since I just began getting back into day trading, you might see very late analyses for a few days. But once I can finalize my posting schedule, I might be able to post more up-to-date analyses. Expect these types of posts to be short reads. Also, do note that English is my second language.
The Analysis
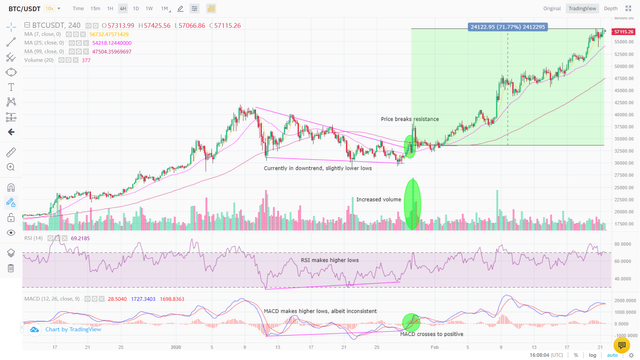
The chart above shows Binance's BTC/USDT pair correction that happened from its Jan-08 high of $41,950. When the rally peaked and turned bearish, the lowest support that BTC found was $30,420. Bears took control of the immediate cycle and soon formed a wedge. During the cycle. the price experience three major rebounds from the $29,400-30,420 price range (the second one was slightly below but was able to still able to rebound). This could signal strong support where bears had a hard time beating.
Looking at the oscillators below, their trends seem to diverge from what the price has experienced. On each occasion, the RSI plotted higher lows. Its MACD also plotted higher lows from the negative, except on the second rebound, when it dipped slightly lower than how an ideal bullish divergence should be plotted. Bullish divergence's usually signal a sharp rally, once every condition is met. All it takes for a rally to happen is for the MACD to turn positive on the edge of the wedge, the price breaching the resistance, and volume picking up.
Thanks to Elon Musk's tweet, all three conditions were met. And those that took long positions as soon as the rally was confirmed realized a 72% price increase.