XBT/EUR ichimoku on multiple time frames: Monday 2018.07.16
Time travelling with Ichimoku
XBT/EUR
Previous Analysis here is proving good so far.
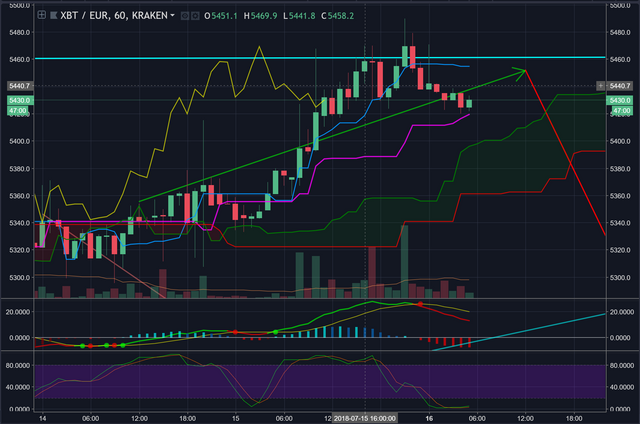
1 hr candles
Over the next several hours I would like to see a continuation of movement along the green arrow as per my chart before starting to fall through the clouds. interesting area to watch is lagging span on the price. Lagging span is currently above price and we should get some support but I expect will break through soon. The end of the green arrow looks like a good place for lagging span to breakdown.
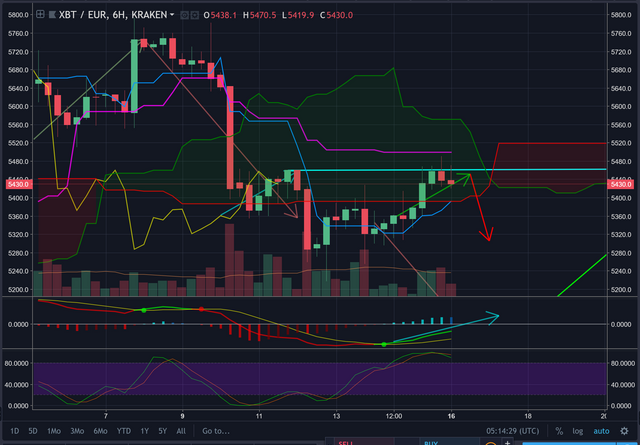
6 hr candles
Lagging span has broken below price and we should see continued resistance over the next few 6 hour candles. I do do not see much upside potential in the 6hr chart now.
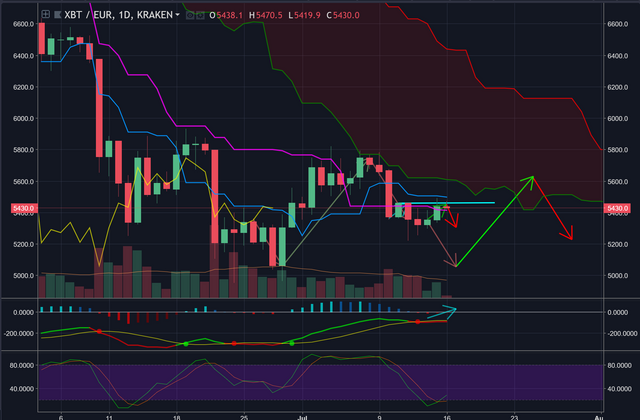
1day candles
1 day chart is looking more positive. There is a potential for a bullish trend to emerge over the next few days. there is plenty of head room space from kumo. Kumo should act like a magnet from this position until we reach it. Hesitancy and apprehension comes from the turbulence at the 6hr kumo. The prediction as per the arrows are looking good so far and I will monitor for any significant divergence from these paths.
Disclaimer: This information is to record and preserve on chain my observations of this technical analysis system, I do not advise making trades with real money from this information. You may lose your shirt or other spurious items of clothing if you trade this information.
Nice analysis. I also think that we might have a small correction soon.
This post has received a 20.78 % upvote from @boomerang.