Bitcoin To MOON Again!? How To Trade an Expanding Triangle Tutorial!
Hello there guys. I have realized bitcoin is in an expanding triangle pattern currently, and when this pattern forms after a substantial up move in price like we had last year, it usually means price will break out to the top of the pattern. So another substantial opportunity for making profit from bitcoin might actually be right around the corner!
So anyway, let's get into this expanding triangle tutorial!
So firstly, what does an Expanding Triangle pattern mean in terms of the investor's directional bias in the market? Well, as with a lot of these triangle price patterns, the investors are a bit bipolar! They initially believe price should rise and so they push price up, and then for whatever reason they think price is struggling and maybe they were wrong and now they are selling. The investors, however, stick to their directional bias more and more as the pattern plays out, before finally it is clear to everyone where the price should really be going.
(Note that since the information of expanding triangles acting as continuation patterns is widely available and known, this pattern becomes a self-fulfilling prophecy like many others).
You can see here I have drawn my technical analysis on the BTC/USD (coinbase) pair and explained my possible entry level, profit target level and where I would place my stop loss for a long position:
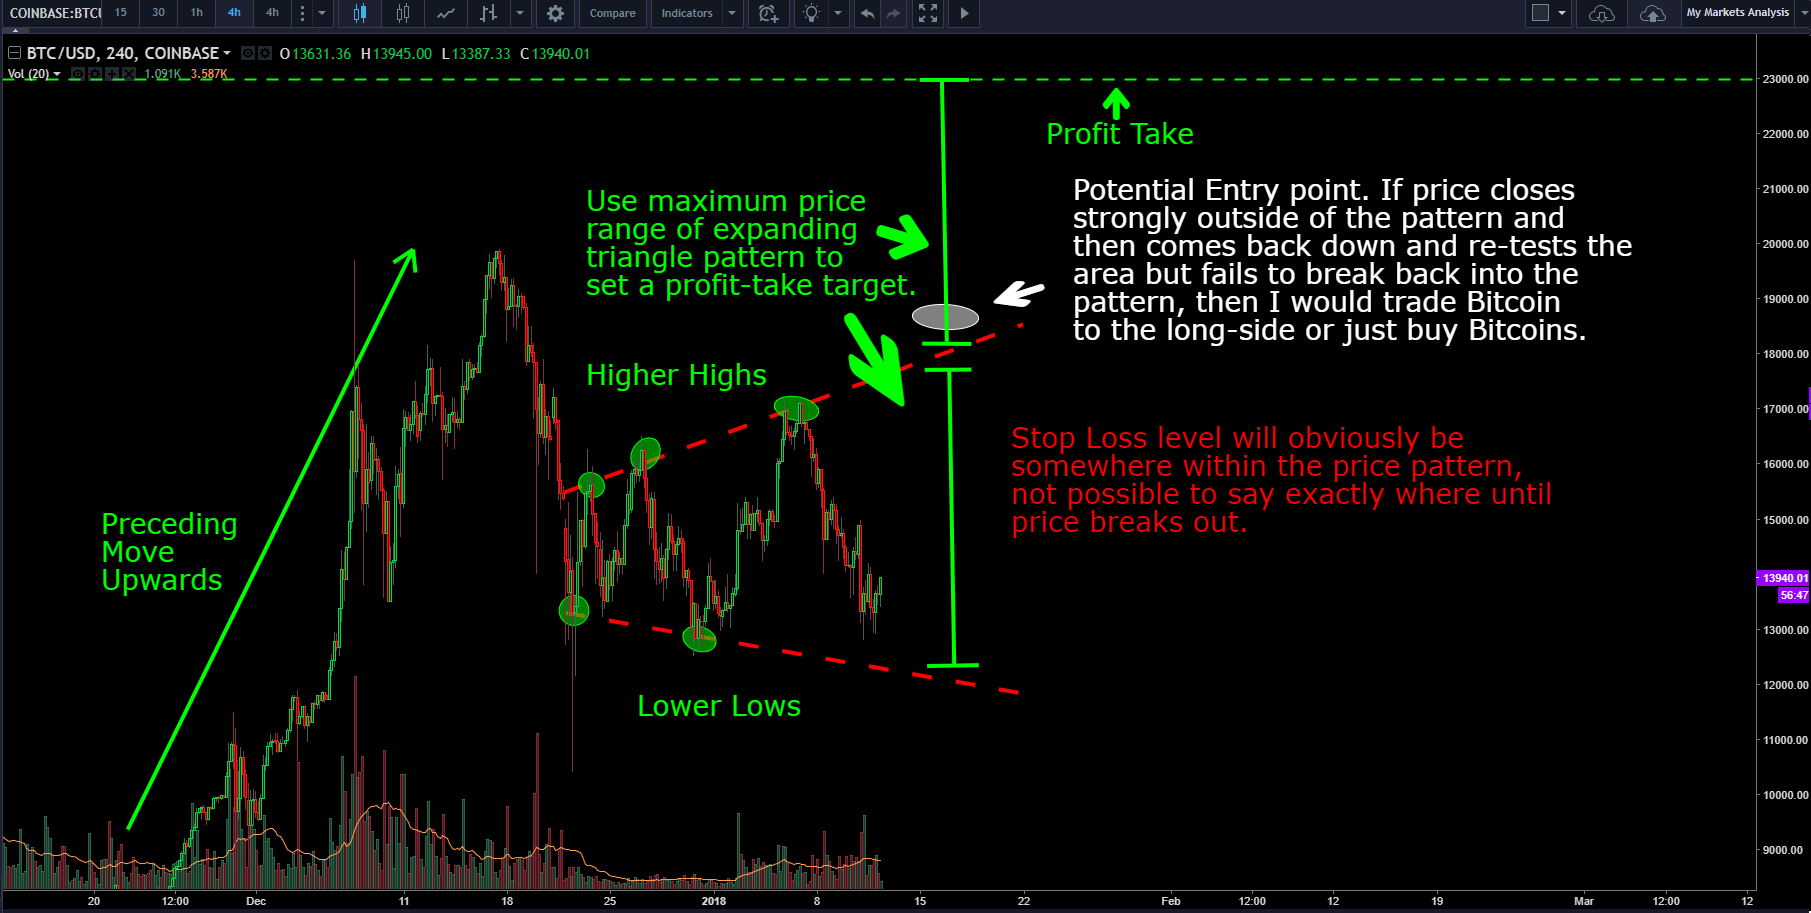
One thing to point out is that there is no confirmation whatsoever right now that btc/usd will break to the upside, it could potentially break to the downside. However, more times than not, as I have said, when price moves upwards into an expanding triangle pattern price will usually break to the upside.
Anyways, it is for sure something to keep an eye on guys if you have any investment in bitcoin or, even better, if you have not invested yet and are looking for a possible entry point. That's it for the tutorial, thanks for reading and as always, up-vote and follow to support me putting out this type of analysis on a regular basis!
Legal Disclaimer: I am not a professional financial advisor, and so do your research beyond reading mine. Do not act on what I say alone, always make your own decisions when investing your own money.
This pattern looks diferently depending on the exchange. Look at combined charts and you will se a potential bearish flag or symetrical triangle.
Great post can go either way but looking at the supports it shouldn't break it thank you for the analysis
Nice post followed and up vote u i hope u will do same for me please