"Bitcoin-Bubbles": A Brief History. :)
The sharp increase in the market value of bitcoin in May 2017 and the ensuing lightning-fast fall of 20-25% led to a renewed talk about a phenomenon like the economic bubble (also called speculative, market, exchange, price, Financial ").
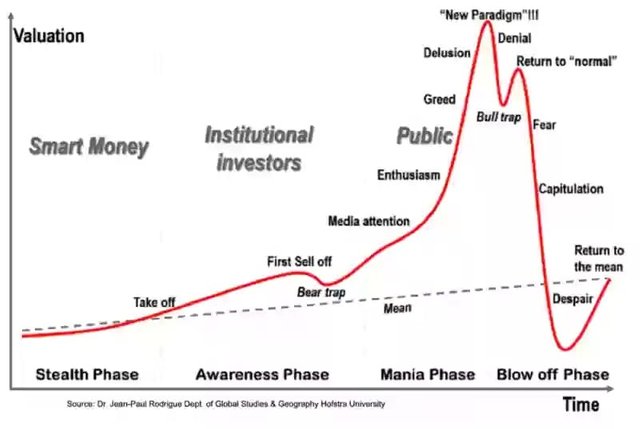
The graph of a typical "market bubble" is presented above. Without going into details, we note four of its main phases:
Stealth Phase - the dynamics of the market price (value) of the asset reflects a long, moderate growth.
Awareness Phase (Avareness Phase) - the interest of the so-called " Institutional investors. There is an increased growth in the market price. For this phase, the so-called. "Bear trap" - a short-term decline in the market value of the asset due to the so-called "bear trap". "Bearish reversal", after which there is already a "bullish turn" with the growth of the growth rate of the market price.
Maniac Phase (Mania Phase) - increased market growth and media attention to it involves the masses, who want to quickly get rich on this growth. There is a sharp increase in demand for an asset, which leads to an even higher price increase - as a result, an avalanche effect begins and the market value of the asset soars.
Phase Bloww off Phase - for rapid growth suddenly follows a lightning-fast fall. But the market is still resisting and trying to restore the price,
Preceding the fall. However, not all asset holders, especially those who entered the game earlier, believe in the recovery and are trying to get rid of it for a reasonably high price. After a short-term growth, a collapse follows, accompanied, as a rule, by a market panic and the value of the asset falls below the level that preceded the emergence of the "bubble". In the end, the price of the asset over time is balanced at the level of the trend, which was in the first-second phase.
In the history of bitcoin, since the beginning of 2009 there have been several outbreaks of its market value, which in character resemble a typical "market bubble".
- The Big Bubble of 2011
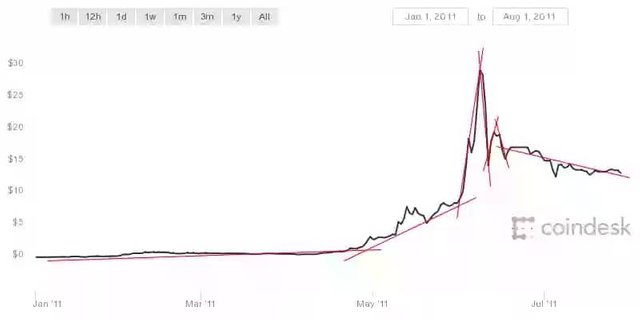
Initially, the market value of bitcoin for a long time was below $ 1. In 2011, bitcoin entered with a market price of $ 0.30, which grew slowly, reaching $ 1 by February 9, but then growth stopped and a slow decline began. Again bitcoin reached parity with the dollar by mid-April. Probably it was a kind of psychological mark (bitcoin equaled the value with the dollar), because after that the faster growth of the value of the crypto currency began - by mid-May, bitcoin was already approaching the $ 10 mark, after which there was a "bear trap" (falling to $ 5) and after Followed by a stir (the manic phase).
On June 2, bitcoin already cost $ 10 and less than a week the rate grew threefold - on June 8, 2011, he overcame $ 30, after which his rate began to fall.
"Bubble" burst on June 11, that day bitcoin fell twice and cost less than $ 15. Then there was still a short-term growth of up to $ 20, after which bitcoin began its slow decline until the summer of 2012. In the spring of 2012, bitcoin went down for the level of $ 5.
Course growth: about 30 times.
Duration: about 3 months.
This bubble bitcoin was called "Big." Its appearance was very similar to the classical "stock market bubble", which was shown in the first picture to this article.
- The Small Bubble of 2013
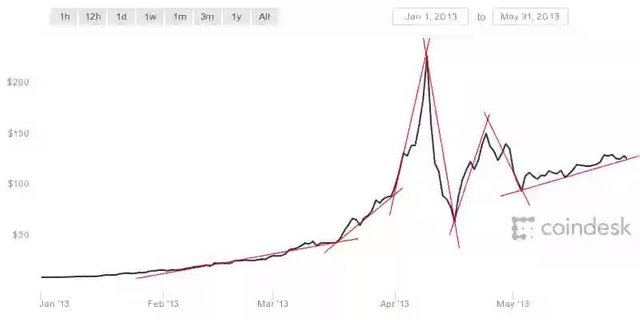
After the previous fall, at the beginning of summer 2012, the growth of the crypto-currency began slowly and by the end of this year bitcoin was already approaching the $ 15 mark.
In mid-January 2013, bitcoin overcame the $ 15 mark and began to increase its growth rate, reaching $ 50 by mid-March. This was another psychological milestone, after which the rapid growth began - on April 1, the value jumped above $ 100, and less than 10 days later, on April
9, bitkoin exceeded $ 230 - the bubble swelled ... and burst - the next day the price dropped to $ 160 , And a week later, bitcoin was already worth less than $ 70, after which he was still trying to recover, breaking the $ 150 level on April 24. But, it was a short-term increase, after which again falling to the level of $ 100.
Course growth: about 17 times.
Duration: about 3 months.
- The Big Bubble of 2013
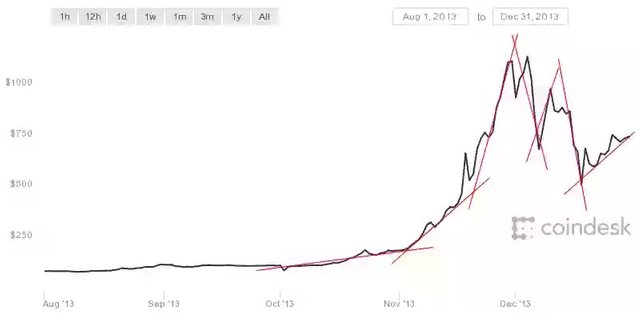
Following the so-called. "Small bubble" in 2013 in the same year, "ripened" and the most famous bitcoin-bubble, during which the price of crypto-currency flew for the first time for $ 1000. After the spring drop, the price of bitcoin balanced at about $ 100 and there were no noticeable fluctuations until the fall. Accelerated growth began in mid-October, reaching $ 250 by early November.
Probably, this was another psychological milestone, as bitcoin set a new record. Rapid growth began - by the end of November, bitcoin not only surpassed the level of $ 1000, but also flew for $ 1,100. After that, the "bubble" began to collapse - in early December, the price fell below $ 700.
Course growth: about 11 times.
Duration: about 3 months.
December 10 bitkoin made an attempt to win back, but never overcome the psychological mark of $ 1000. After that, a long slow decline began, which ended only in the fall of 2015. At the same time, in summer 2015 bitcoin fell below $ 250.
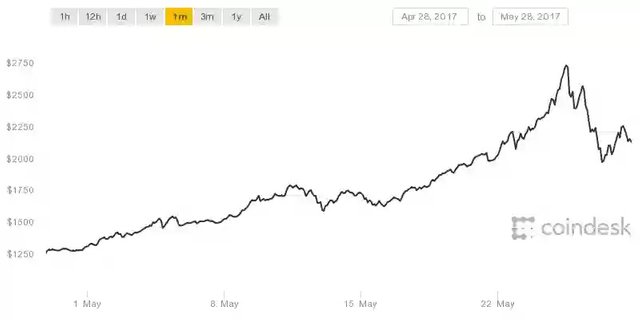
The new growth, which began in the fall of 2015, ended with another "bubble" in May 2017 - on May 25, bitcoin flew for $ 2,700. But, two days later he collapsed for $ 2000.
Course growth: about 4 times.
Duration: about 6 months.
What will happen next?
Look at the graphs of "bitcoin-bubbles", which were given above. They all differ from the classic chart of the "stock market bubble" that, having reached a maximum on the manic phase, bitcoin never fell below its level in the latent phase and even in the phase of awareness.
This means that bitcoin has never fallen below the level of the previous "bubble" after the "collapse of the bubble". Those. For long time intervals bitcoin so far has a stable uptrend and we are waiting for a new burst of bitcoin prices with a level much higher than the previous one.
It should also be noted that the multiplicity of inflation of the "bitcoin bubble" decreases all the time. If the first "bubble" in 2011 had a 30-fold increase, then in 2013, already 17 and 11-fold growth. And the last "bubble" in 2017 swelled, and at all up to 4 times the price increase.:)
Thanks for a long and interesting post which explains about BTC bubble.
I think bitcoin will fluctuate up and down, but to call it a bubble is to miss the key point. We are about to see a big change from fiat currency to something more democratic.
You can read more about my views (if you're interested) here:
https://steemit.com/bitcoin/@kabir88/the-future-of-money-beginners-guide-to-money-bitcoin-and-crypto-currency
very useful and easy to understand explanation! :)
Upvoted and followed
You may want to check my post about bitcoin too?
This is the second google hit I found for "bitcoin bubble history" - nice work! It's very nicely layed out and timely for the current correction.