Bitcoin (BTC) Morning Update: Why Am I So Bullish on Bitcoin?

SUMMARY
**Note: All emails have been sent out to the selected Founders Membership shortlist entries!! Please click on the registration link on the email to complete the process!! **

As of June 4, ALL Crypto Analysis will be posted on the BitcoinLive channel and Steemit will be dedicated for Equity, Commodity and Options Analysis. To Signup for the BitcoinLive limited Founding Membership slots, use this link: https://get.bitcoin.live/haejin/
__
Yesterday, I had posted the below Inverted H&S pattern as the primary count and projection. The Volume confirmation was pretty much had and the pattern was nearly complete and price confirmation was projected. Price confirms the pattern by decisively breaching the neckline (white).
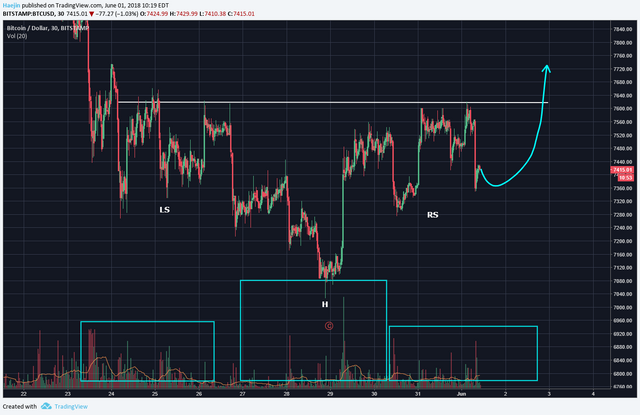
Today we have the following chart where price rose to complete the RS (Right Shoulder) and has breached the neckline. So, as a pattern, this bullish Inverted H&S has confirmed in volume, price and pattern completion. The minimum price run is set to $8,250. When adding the Elliott Waves, we see that the white impulse represents the second round of impulse which should provide solid confirmation of a trend reversal from down to up.
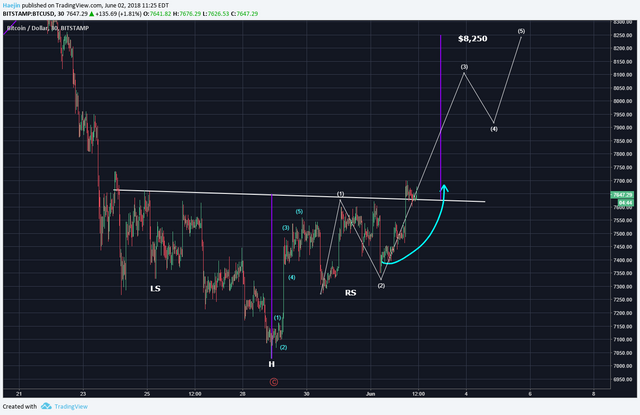
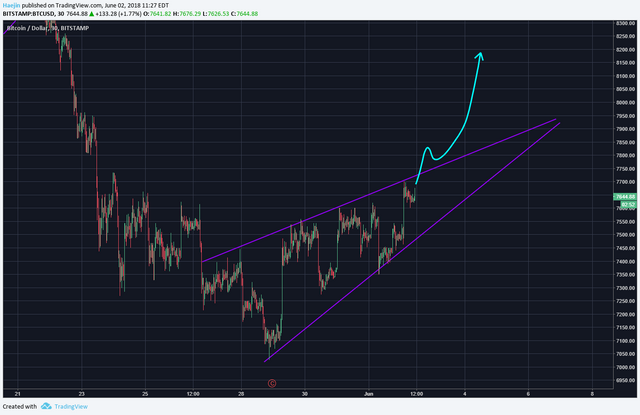
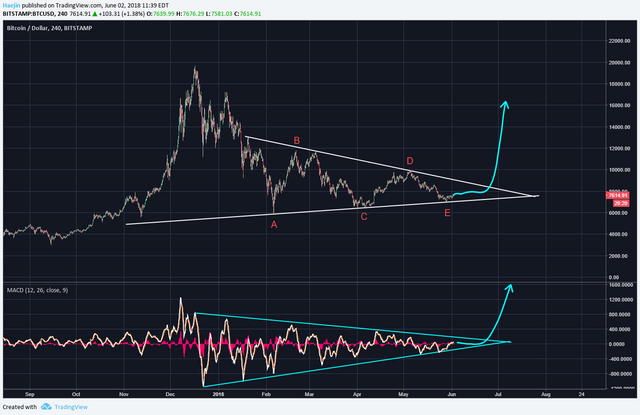
Still, keep into awareness the upward wedge (purple lines). This looks more and more out of shape as price rises and should price exceed the upper purple line as shown by the blue arrow; it would become invalidated.
Why am I so bullish on Bitcoin? The below chart to me is massively bullish pattern for both the price and MACD. The two basically have near exact same pattern! If we label the pattern as ABCDE; it appears to be COMPLETE! Price might go a bit sideways to get closer to the apex; but the coming explosion will be a sight to behold!! Video has more details!!
Legal Disclaimer: I am not a financial advisor nor is any content in this article presented as financial advice. The information provided in this blog post and any other posts that I make and any accompanying material is for informational purposes only. It should not be considered financial or investment advice of any kind. One should consult with a financial or investment professional to determine what may be best for your individual needs. Plain English: This is only my opinion, make of it what you wish. What does this mean? It means it's not advice nor recommendation to either buy or sell anything! It's only meant for use as informative or entertainment purposes.
Please consider reviewing these Tutorials on:
Elliott Wave Counting Tutorial #1
Elliott Wave Counting Tutorial #2
Elliott Wave Counting Tutorial #3
Laddering and Buy/Sell Setups.
Laddering Example with EOS
Tutorial on the use of Fibonacci & Elliott Waves
@haejin's Trading Nuggets
Essay: Is Technical Analysis a Quantum Event?
Follow me on Twitter for Real Time Alerts!!
Follow me on StockTwits for UpDates!!
--
--


Future Kaboom!
This guy has never seen a chart he didnt like
yep
Thanks for everything, Haejin! I will miss your analysis. All the best for the Bitcoin.live project.
Hello, many thanks for TA.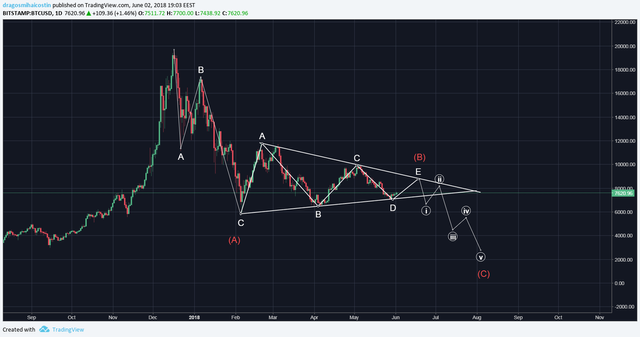 )
)
I just made an acount on bitcoin live.
I have a curiosity which i do not understand, why the triangle is bullish and not bearish like this :
![bear btc.png]
(
Thanks !
A symmetrical triangle and the MACD triangle indicate that a massive price action is happening -either huge price pump or massive price crash. However, Haejin believes that a massive bear market to the 2 or 3ks is very unlikely as he believes in the value of cryptocurrencies, so he favors the bullish scenario.
Many thanks for the explanations!
Indeed, same question. The same applies for the picture with the purple wedge...
A rising wedge is indeed bearish. However, he is saying there are more bullish signs -inverse head and shoulders and the Elliott Wave count- than the bearish signs. Although most rising wedges break down, not all do. He is suggesting that due to the bullish signs, the wedges may be invalidated.
crazy analysis!
Kaboom!
Coins mentioned in post:
Hope we see $10k by end of June
Many thanks Haejin. I am confused by your picture. The purple ascending triange looks like a bear wedge and therefore suggest a steep decline once we near the 8K and at the terminal end of the wedge. Appreciate your views. Many thanks
You were right!
Waiting for the apex to hit on both charts and go apeshit up!
Go haejin! Go BTC to the moon!