Bitcoin TA - summary of analysts - 22. July 18
Regular daily update on BTC ta analysts opinions.

My summary - short-term (next 24h) sentiment: bullish (last: bullish)

RSI on 12hr and 4hr are coming back from oversold.
We are still consolidating at the 7'400 level
Next major resistances are 7'664 (MA128 daily, November 2017 top), 7'780 (Mid line Bollinger Bands weekly) and 8'280 (MA50 weekly).
It seems in the war of the bears and bulls we are entering another battle: Can the bulls create enough FOMO to create distance to the lows and overcome major resistance levels? If so we are not going to see the current levels for a long time.
Or do the bears lead the bulls into a trap and than smashing hard to the downside. That would create a lot of frustration and might lead to the capitulation which you would expect to be necessary to call the bear market over.
Bull scenario*:
- We reconfirm the 6'800 or 7'000 level in a pull back gathering strength for another move up.
- That confirms a higher low and bullish 5 wave count.
- Alternate: Bull flag is forming - that brings us directly to next resistance level at 8'300 from here.
- Volume needs to increase.
- We overcome the death cross area of the 30/50 week MA and break above it.
Bearish scenario*:
- We move up for one or two weeks into the death cross (30 and 50 MA weekly) at around 8'500 and than drop significantly.
- Alternate - bears are turning after the RSI gets oversold and make a lower low
- After breaking 5'800 a significant drop towards new lows in the range of 4'975 and 4'300.
*scenarios based on daily-candles - so around 4-14 days timeframe. See also definition section
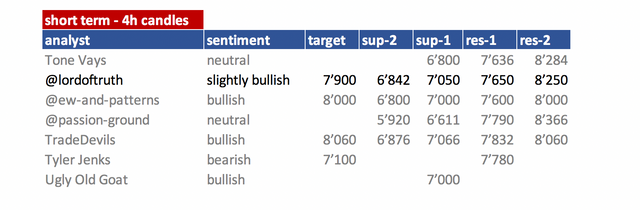
Summary of targets/support/resistance of TAs
Short-term overview
mid- and long-term overview
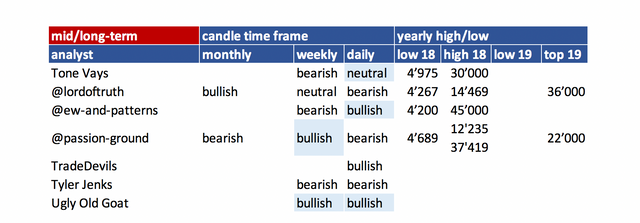
- please refer to definition section for time-horizon.
- be aware that mid- and long-term is mostly my interpretation of what analysts sentiment is as they not always clearly differentiate those time-frames. To interpret that consistently is very hard so please be kind with my interpretation.
- you can easily spot which analyst did an update
(block writing - grey ones don't have an update today).
Their changes are in light blue.
Helpful statistics:
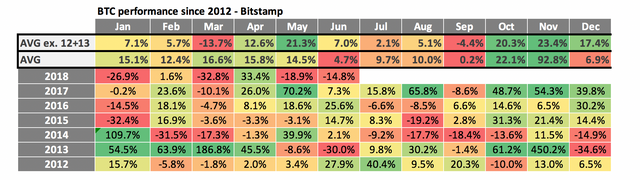
monthly performances
- Added 2012 + 2013 on request.
- As 2012 and 2013 the % move are gigantic I added two averages. One without 2012 + 2013.
- June performance was very weak. With -14.8% clearly below the average of the last years. With 2013 this is the only negative month at all.
- July is a mixed bag - 2 year positive performance and 2 year of negative performance. 2012 and 2013 were positive though.
- The average is positive with 2.1% but that is mainly due to the bull rund 2017. The average incl. 2012and 2013 is even more positive. That is mainly due to the 40%+ spike in 2012 so I wouldn't rely on that.
So just looking at this table we probably facing another negative month.
News about the blog
- None
Analysts key statements:
Tone (neutral):

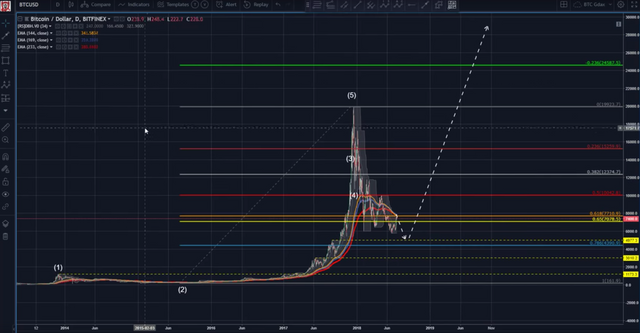
Quarterly chart: We are almost done with 1-4 correction. October / November could be the bottom.
Monthly: Flipped from red to green. That can be good or bad. If next month trades above the current that could be bullish. you need to get above 9'000 be green though.
Short-term outlook:
- Weekly: Still in 7'400 range. We got a price flip.
Unchanged:
We are coming on to a death cross. We had a good week which came off the 9. We might pull up to the death cross. Lets see if we make it there - this would be a clean short trade. That should be around end of month or beginning of next week.
SAR are taken out - that is bullish. But we had that also in 2014 before reversing.
Bollinger band are to far spread for a typically bottom. You want this to be narrow a the bottom. - Daily: We have major resistance at 7'600 (even from last year). The MA 128 turned us at 10'000 it might turn us here - that resistance is serious.
We have a bullish flag pattern - the target is 8'300 - which would bring us at the range of the death cross.
@lordoftruth (slightly bullish):
After holding steady above 7'400 for a few days Bitcoin price has fallen back to 7'271 and the price start again to consolidate to avoid the downside situations again, trying to make a way for 7'650 resistance, where we believe that a further declines around 7'650 could happen for dropping towards 6'842 again as Most likely Bears will regain the control facing a selloff around 7'650.
Most likely a Pull Back after testing 7'650 ( The top of Nov 2017 ) will be in play, towards 6'842.
Conform Weekly Chart is so early to believe that, the bear market is over, so we must be cautious as the Weekly Setups stands the same.
Todays trend is slightly bullish. Trading between 7'000 and 7'650.
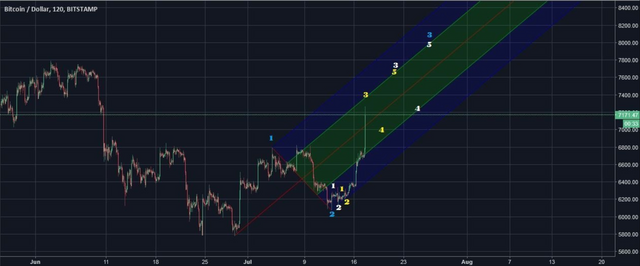
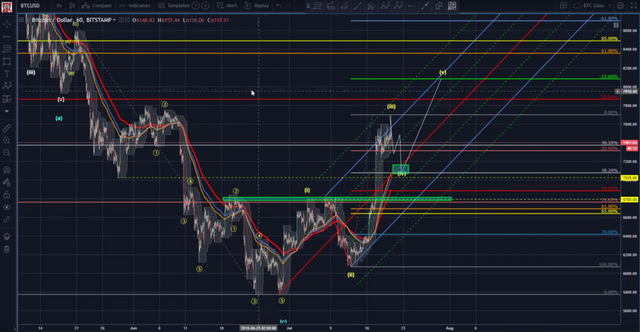
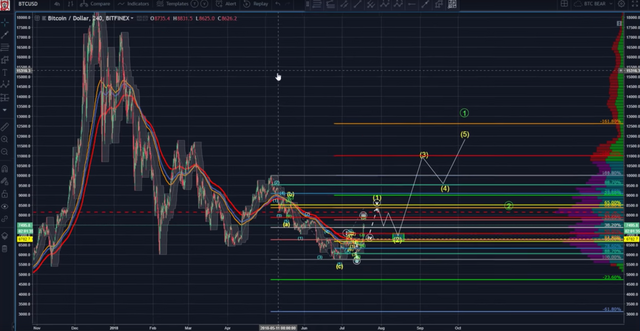
@ew-and-patterns (bullish):
Update:
He was thinking of a move within a triangle but that seems to be off the table.
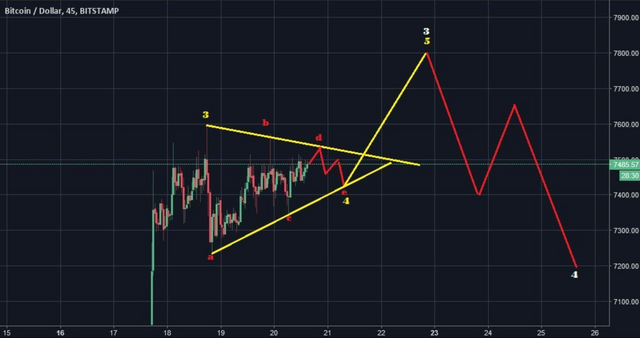
Rather he sees the current move to be either end of white wave 3 or C leg of yellow wave 4.
older news - still valid:
It is too early to call it a bottom, but I want to show you the best case today. Let's say this impulse wave continues past 8'000 and finally past 10'000...
If so, this is the most probable best case.
It would form a cup pattern, possibly with a handle afterwards.
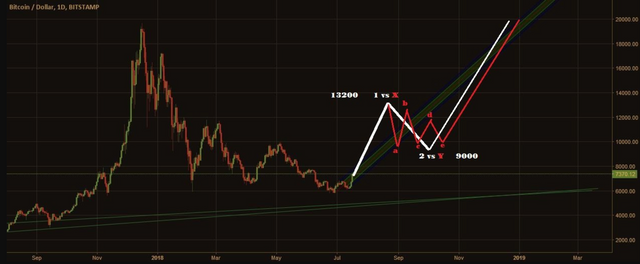
This move could bring BTC up to 13'200 for wave 1 or X. If it's wave 1, we will likely see any other correction but not a triangle. If it is wave X though, a triangle is very likely due to the rule of pattern alternation. We would have a ZigZag for W, an expanded flat for X and a triangle for wave Y (red).
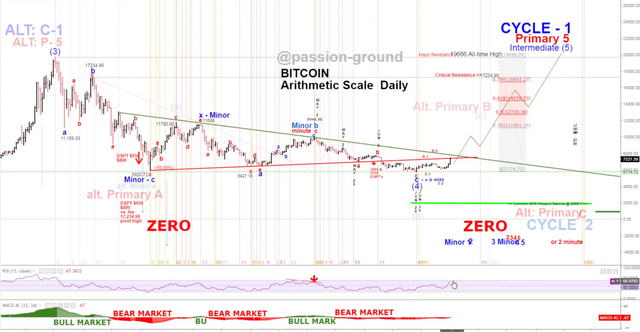
@passion-ground (neutral):
Here we are, and yet – it still ain’t over till’ it’s over… …the BEAR MARKET that is.
Bearish on the higher level. Next turn month is August.
Daily at his R1 line and gets rejected so far. We are rapidly moving towards RSI overbought.
Weekly - we are moving into a buy signal - long term. We are about breaking out of the downtrend (log chart). We are in a descending triangle and breaking upwards.
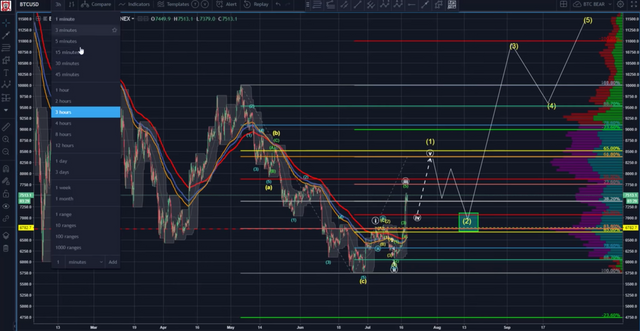
TradeDevils (bullish):
Bullish case:
After wave 3 is completed we fall to the 0.382 level at 7'066 completing wave 4 and move as wave 5 to 8'060 level. That would be a strong indication for a now wave 1 higher degree and a trend change (towards bullishness).
Bearish case:
We move up to the 8'000 area completing a ABC correction as wave 4 of 5 waves down of the C wave. That would lead to the 5'200 - 4'800 target zone.
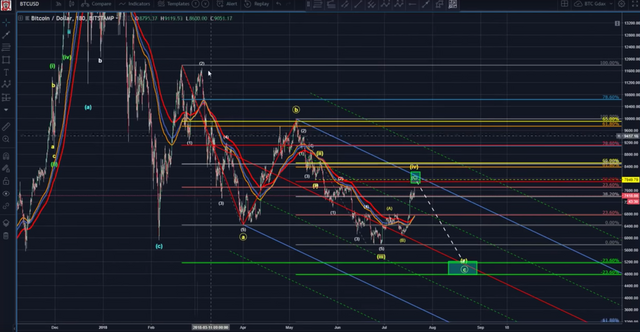
Big picture:
He sees that the current move was a 5 wave move to a one and we are looking at a deep 2 which leads towards 4'390 (0.786) and than to a wave 3 with much higher prices.
He sees lots of positive signs for the bullish case.
Expected that we are correcting towards 7'100 before moving higher towards the 8'300.
Than he expects a bigger correction towards 7'000 area confirming a higher low. That would be very important and supports the bullish case strongly.
If that gets to be true we are probably up to the races towards all time highs. See bigger picture below.
Tyler Jenks (bearish):
SAR has been hit. That is his only point of bullishness.
Bollinger bands are very wide and we are below mid-line. We would need to get above the mid-line and close above 7'780 - to get a bullish signal. If we would get that - we would need to get to the upper bollinger band channel at 9'500 to continue strength.
Volume on weekly is still trending down.
Moving averages (weekly) are moving to the downside. 2 - 7 - 14. We are above short and mid-term. We are above the first two ones but we are below long term and that one is heading down. Also intermediate is still moving down. That signals a neutral to negative chart.
RSI came a bit up - for him that could be interpreted as taking breath for further downside as we have never been oversold. Also we have not gotten back to last peak. He is also not expecting us to.
MACD is getting better "negative" but we are still negative.
He is impressed that the SAR is taken out - but that is his only long term indicator that he is using which is positive. The rest is neutral to negative and he expects this move to slow down and turn soon.
He has positioned itself still in cash and is convinced that he can buy BTC below 5'000 at some time in the future.
UglyOldGoat (bullish):
He sees that alt-coin money - especially form eth - is flowing into bitcoin keeping us up. That weakens the ETHBTC price.
Furthermore he expects that as soon as it escalates towards a drop oft ALT/USD ETH/USD that this will create a panic and bring BTC to the long expected break below 6'000 price level.
It seems volatile times ahead...
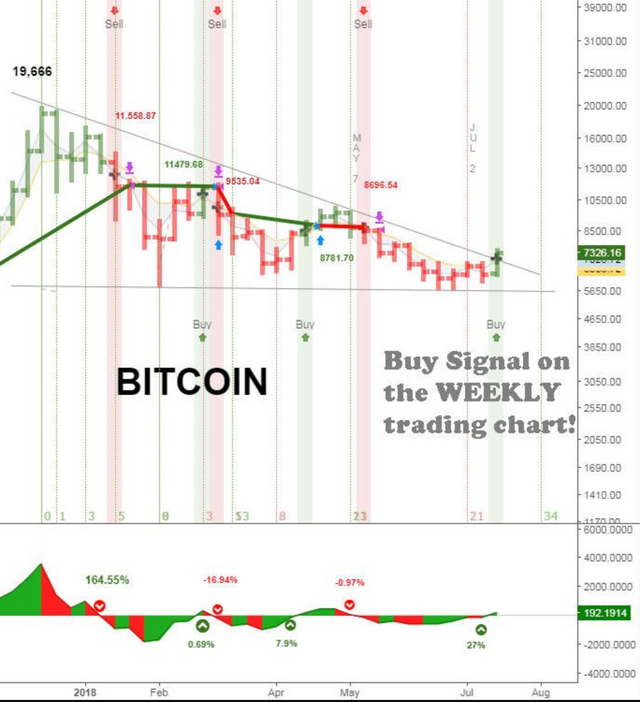
IT's time to pull the trigger
The basis, relative strength, the timing indicators all say it is time to pull the trigger and risk 1st and 2nd quarter lows. Yes, if we break it will be hard but that is fear. . . everything else says this is a low risk time and place to be a buyer.
Reference table
| analyst | latest content date | link to content for details |
|---|---|---|
| Tone Vays | 18. July | here |
| @lordoftruth | 22. July | here |
| @ew-and-patterns | 20. July | here |
| @passion-ground | 18. July | here |
| @tradedevil | 20. July | here |
| Tyler Jenks | 18. July | here |
| UglyOldGoat | 20. July | here |
Definition
- light blue highlighted = all content that changed since last update.
- sentiment = how in general the analysts see the current situation (bearish = lower prices more likely / bullish = higher prices more likely). The sentiment is based on 4hr, daily, weekly, monthly candle charts.
- The forecast time horizon of candles can be compared with approx. 4hr = 1-2 days; daily = 4-14 days; weekly = 4 - 14 weeks; monthly = 4 - 14 month.
- target = the next (short term) price target an analysts mentions. This might be next day or in a few days. It might be that an analyst is bullish but sees a short term pull-back so giving nevertheless a lower (short term) target.
- support/res(istance) = Most significant support or resistances mentioned by the analysts. If those are breached a significant move to the upside or downside is expected.
Educational links:
- From @ToneVays: Learning trading
- From @lordoftruth: Fibonacci Retracement
- From UglyOldGoat: How to achieve the same results of a professional trader without taking the inherent risks
- From @philakonecrypto: Like in every post you find links to his amazing educational videos. For example here. In addition he has an online course which you can find here
- From @haejin: Elliott Wave Counting Tutorial
*If you like me to add other analysts or add information please let me know in the comments.
right analyst of bitcoin
https://steemit.com/travel/@tanveeran/67fcyp-photogrphy vote me
amazing blog ...have so much things to learn from it .. thanks again
Congratulations @famunger! You have completed the following achievement on Steemit and have been rewarded with new badge(s) :
Click on the badge to view your Board of Honor.
If you no longer want to receive notifications, reply to this comment with the word
STOPTo support your work, I also upvoted your post!
Do not miss the last post from @steemitboard:
SteemitBoard World Cup Contest - The results, the winners and the prizes
finally the bears tire out!
Some bearish outlooks start to appear :D
I follow some of them on Youtube also, but it's nice to have all the opinions in a single post.
Guau!! Awesome post!! I think I'll stop by every day before I start trading
Amazing analysis, very thorough... Gonna follow you and check your posts... Check my posts as well and see if you like it... Cheers
Congratulations @famunger! You have completed the following achievement on Steemit and have been rewarded with new badge(s) :
Click on the badge to view your Board of Honor.
If you no longer want to receive notifications, reply to this comment with the word
STOPDo not miss the last post from @steemitboard:
SteemitBoard World Cup Contest - The results, the winners and the prizes