Bitcoin TA - summary of analysts - 11. June 18
Regular daily update on BTC ta analysts opinions.

**My summary - short-term sentiment: bloodbath ** (last: bearish )

Bloodbath - we dropped below 7'000 to 6'700 area which supports us for now.
Bearish scenario (preferred):
We broke down also the 7'050 which fuels the bearish scenario even more.
Next levels to watch are 6'600 (April 4th close) - 6'425( April 1st low) - 6'000 (Feb 5th los).
Bull scenario:
Seems much more unlikely now - we need to see a significant rally up to confirm any momentum to the upside.
- @haejin: He is posting bitcoin only on bitcoin live anymore. I am trying to reach out to him to see if we can have an abstract here.
- Lets see how June plays out -usually also a bullish month. Are we going to see a compensation of May with a huge rally up?

News about the blog
I need to revise my 2018 long term table. I need to add a 2018 and 2019 target an be more precise on the sentiment here. Will do that after I am back in Switzerland.
We lunched the bounty project beta. If you are interested and you like to create a bounty on your own have a look at this post
Analysts key statements:
Tone:

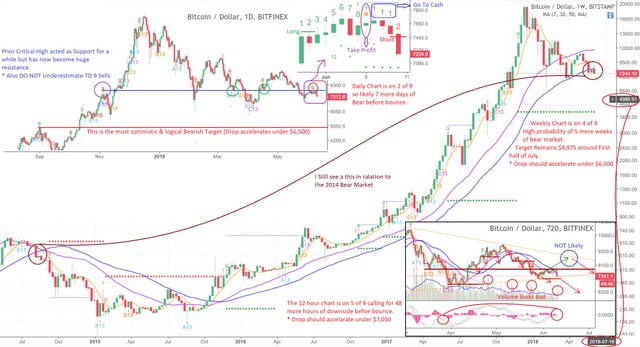
- Weekly: It is very similar to August 2018. Current week is a red one - next would be a flat one according to "script".
- Daily: Volume peaks are on red days - lot of selling pressure. He thinks the scenario to go back up to the top of the triangle becomes unlikely. We are below 30 MA 12hr. He sees no bullish signals anymore and see us going down to 4'975 (prior high in November) until 16th of July.
@haejin:
@haejin is moving his analysis to bitcoin live. Those of you who want to follow him directly should look into subscription. I will try to get in contact to see if I can use an abstract to post here also in the future.
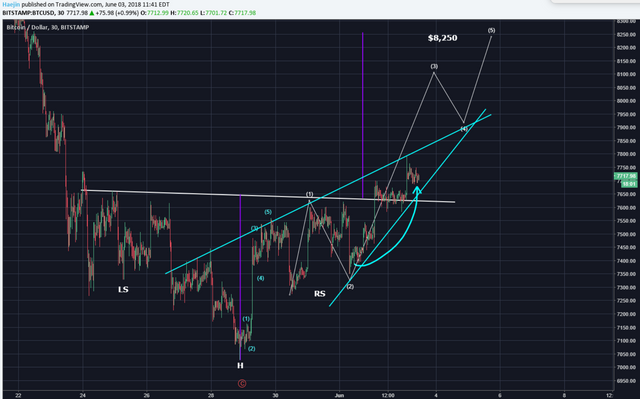
Bitcoin did a small surge to decisively breach the Neckline of the Inverted H&S pattern. The target for the minimum run for the IHS is 8'200. However, keep into awareness the upward pointing wedge pattern (blue lines). Price will likely go sideways again for most of the day and if there is one more surge, it will either breach the top blue line and invalidate the wedge pattern or validate and confirm it with a decline.
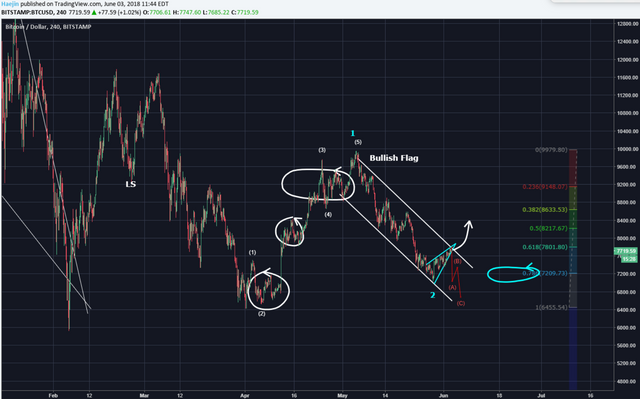
The bull flag pattern is still in progress. Note how the wedge pattern is now sitting just below the belly of the upper white trend line. So, a decision needs to be made. An upside breakout would provide the pathway to the 8'200 target for IHS. However, a downside could jive well with the MACD progression. What does this mean? The next chart clarifies.
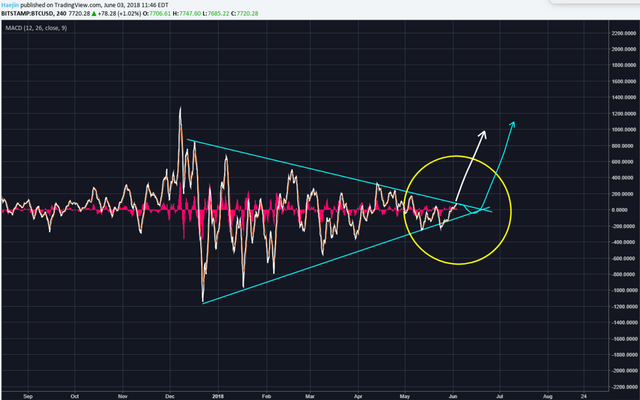
Note how the MACD is at the belly of the upper blue trendline. I believe it could do one more turn down towards the lower blue trendline. This turn in MACD could also mean the 6'700 level or so.
@ew-and-patterns:
It is starting to look better. This might be the start of the next impulse wave. BUT:
Keep in mind that we want to see a decisive break of 10'000, before we can assume a stable uptrend.
This could just be wave e developing right now. If it is wave e, we will see a sharp U-turn in the range of 8'800-10'000. If you see that kind of reversal be in high alert mode.
The problem I see is, that even if it is blue wave 1 developing, it could still reverse in the 8'800-10'000 area and be only blue wave 2.
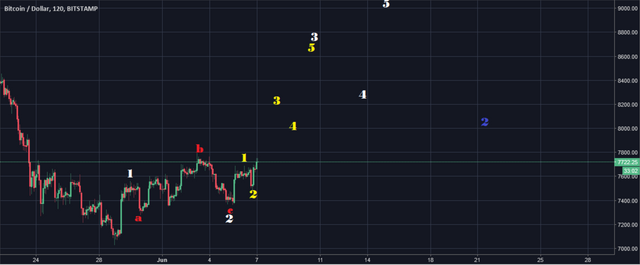
If it is blue wave 1 and wave 2, it will likely reverse to the upside again around 8'000.
We won't know for sure until in a few weeks. Just be aware of the risks. Targets for wave C range from 4'500 -2'400....
Targets for blue wave 1 and 2 range from 12'000 - 17'000.
He will be gone for holidays starting on the 07.06.18 until 14.06.18.
@lordoftruth:
Bitcoin price traded with strong negativity to succeed surpassing our first target at 7'050 and settles below it, paving the way to head towards our next targets at 6'519 / 5'878 / 4'267.
At press time, bitcoin is trading around 6'800 and the chances is valid to achieve more decline, as sellers continue with their drive towards 4'267.
The 2 Weekly Bearish Stop Grabbers suggest drop below 6'519, to test 5'878 reaching 4'300 area.
Todays trend is bearish. Trading between 6'200 and 7'150.
@philakonesteemit:
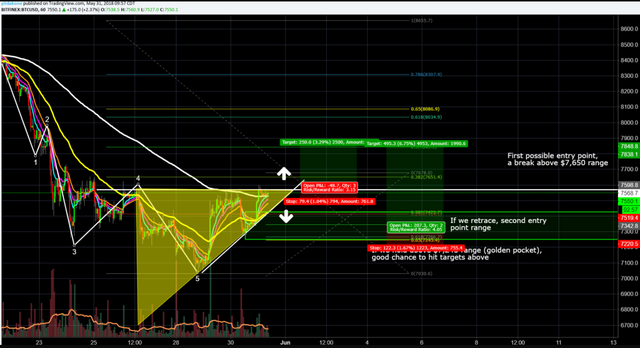
A bounce at the 7'000 level was much expected due to hitting a major trend line support established since Nov 11, 2017.
Bullish View, if we break the 7'650 range, there's a chance to hit 7'850 to 8'000 range (0.5 to 0.618 fib retracement)
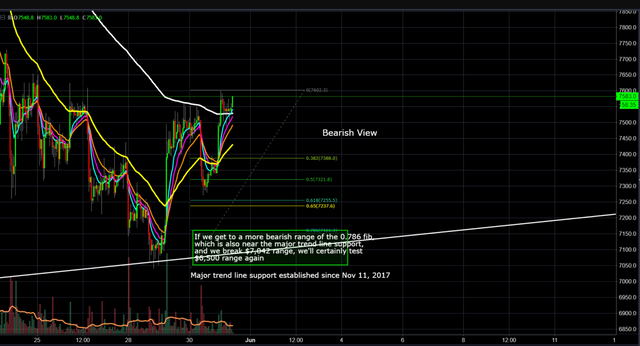
Bearish View, if we break 7'161 range, we'll most likely test 7'040, which I see as failing to hold and then testing 6'500.
@passion-ground:
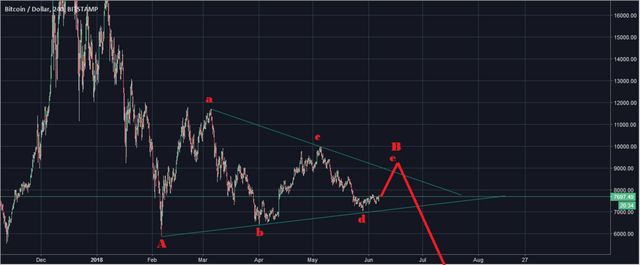
It is looking more and more like a retest or breach of the current bear market low south of 6'000 is in the cards.
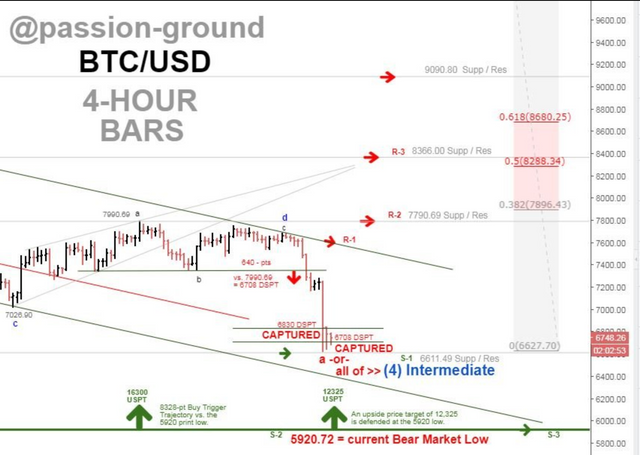
He is abandoning his most bullish preferred count showing that BTC has already put in its bottom at an intermediate (4) wave base, and give preference to one of his more elongated bearish counts to this same regard instead.
When this short-term oversold low is finally in place, wherever it may base, he needs a really strong impulsive rally to the upside in order to resume a preferential view of a newly established (4) wave base.
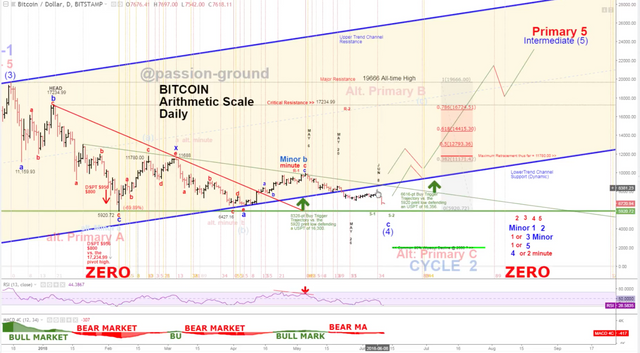
Otherwise, he’ll be switching his preferred count to a bearish one he illustrates clearly on his long-term monthly chart.
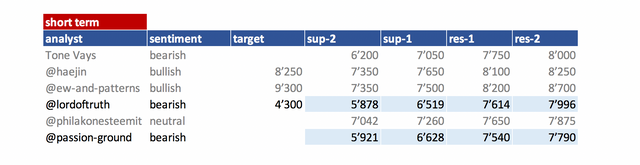
Summary of targets/support/resistance
Reference table
| analyst | latest content date | link to content for details |
|---|---|---|
| Tone Vays | 10. June | here |
| @haejin | 03. June | here |
| @ew-and-patterns | 07. June | here |
| @lordoftruth | 11. June | here |
| @philakonesteemit | 31. May | here |
| @passion-ground | 11. June | here |
Definition
- light blue highlighted = all content that changed since last update.
- sentiment = how in general the analysts see the current situation (bearish = lower prices more likely / bullish = higher prices more likely)
- target = the next (short term) price target an analysts mentions. This might be next day or in a few days. It might be that an analyst is bullish but sees a short term pull-back so giving nevertheless a lower (short term) target.
- support/res(istance) = Most significant support or resistances mentioned by the analysts. If those are breached a significant move to the upside or downside is expected.
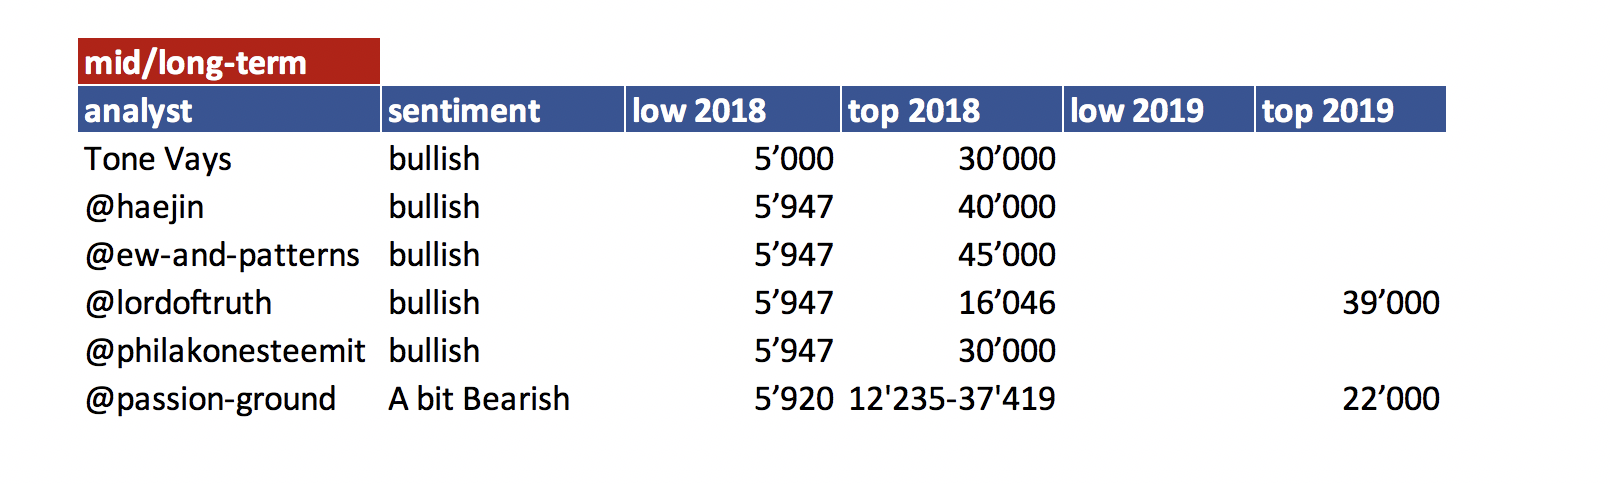
- bottom = -> now renamed and moved to long term table. Low 2018
- low/top 2018 = what is the low or the top expected for 2018?
Further links for educational purposes:
- From @ToneVays: Learning trading
- From @philakonecrypto: Like in every post you find links to his amazing educational videos. For example here
- From @lordoftruth: Fibonacci Retracement
- From @haejin: Elliott Wave Counting Tutorial
*If you like me to add other analysts or add information please let me know in the comments.
Feels like I'm the only HODLer left. Hope holding on isn't going to continue crushing me.
I am pretty sure they are all bullish long term. If you are a straight up hodler with no interest in trading the swings then just stop reading this. It is not aimed at you anyway. Just check the price once a month to see where you are.
Little tip - Center your images / Titles :D
You are right - would you mind adding how that is done?
You can add this:
It works with texts and everything else makes it looks better
Great - thanks.
Well done collecting all these data. It seems to me that in mid term it will be better if you just buy now.
@ew-and-patterns posted an emergency update today from his holiday location.
EMERGENCY UPDATE 11.06.18: Not a triangle - it's an ABC. The break out suggests a drop to 3300$ is going to happen. The low is expected in early August! Next chart update on 14.6. I will not sell any crypto holdings, because I am quite sure the correction will be over in August.
Thanks for bringing that to my attention. It was hard to spot. Included it today.
Where is this post?
Peter Brandt also confirmed that the pennant formation did not qualify as ascending triangle. Have a look at the recent vid released by @tradedevil about BTC still in correction phase. Difficult to swallow, but it seems to be true. For more analysts summaries come and visit. Thanks @famunger for your brilliant updates. Be blessed
The link to his blog is above in the article + updated my comment to provide a direct link. It’s a bit confusing as he wasn’t going to make any updates this week due to holiday but he updated with this emergency update as I copied above.
Thanks, I read his post when he made it but because he did not repost or make a new post I didn’t realize he updated it.
Congratulations @famunger! You have completed some achievement on Steemit and have been rewarded with new badge(s) :
Click on the badge to view your Board of Honor.
If you no longer want to receive notifications, reply to this comment with the word
STOPTo support your work, I also upvoted your post!
https://steemit.com/airdrop/@hirenkapadia/get-0-02-ether-worthusd10-for-signup-on-bitrue-exchange
@famungerThanks for the great contributions. good work. I follow