Bitcoin TA - summary of analysts - 03. June 18
Regular daily update on BTC ta analysts opinions.

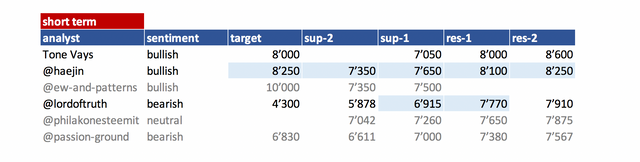
**My summary - short-term sentiment: bullish ** (last: bullish)
Comments unchanged:
- Critical support 7'000 - 7'200 bounced us and seems to establish itself as swing low holding us for some time.
- We have Tone and @lordoftruth seeing this move up short lived and lower lows coming soon.
- Tone did switch short term (12hr chart) bullish while staying bearish on the weekly. He is seeing us going up to 8'000 - 8'600 max and than down.
- @haejin turned fully bullish seeing us going up in impulsive wave with potential huge run up.
- So it looks short term bullish.
- Still we need to break in this move 10'000. If not the likelihood of seeing new lows is increasing significantly. If we fall below 7'050 it will be very ugly.
- May is usually a strong month. But not this year. We started at 9'240 and went all the way down to 7'485 (-19%). Lets see how June plays out -usually also a bullish month. Are we going to see a compensation of May with a huge rally up?

News about the blog
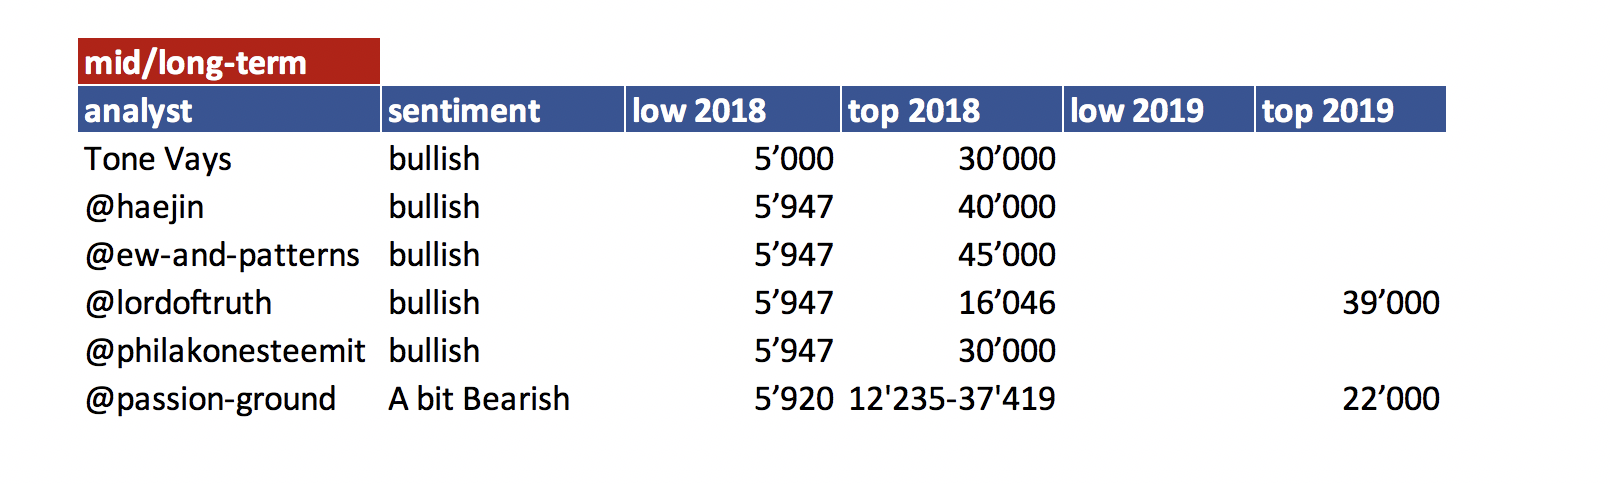
I need to revise my 2018 long term table. I need to add a 2018 and 2019 target an be more precise on the sentiment here. Will do that after I am back in Switzerland.
We lunched the bounty project beta. If you are interested and you like to create a bounty on your own have a look at this post
Analysts key statements:
Tone:
- Weekly:
We are still below 50 MA week. Close of week is interesting to watch if we close above 50 MA. Still chart looks bearish. - Daily: He expects this bounce to end at 8'000. If it goes above that he expects us to turn latest by 8'300.
@haejin:
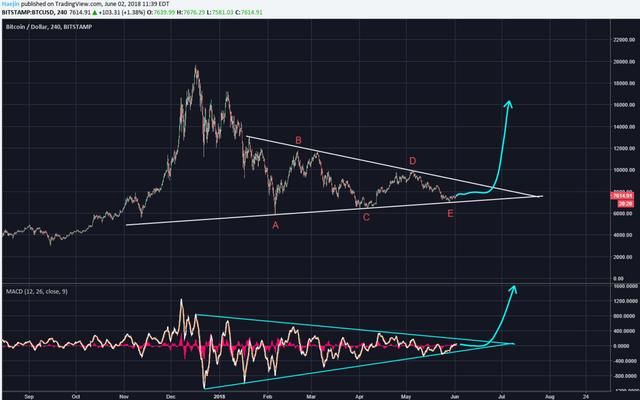
Inverted H&S pattern primary count - Price now confirms the pattern by decisively breaching the neckline (white).
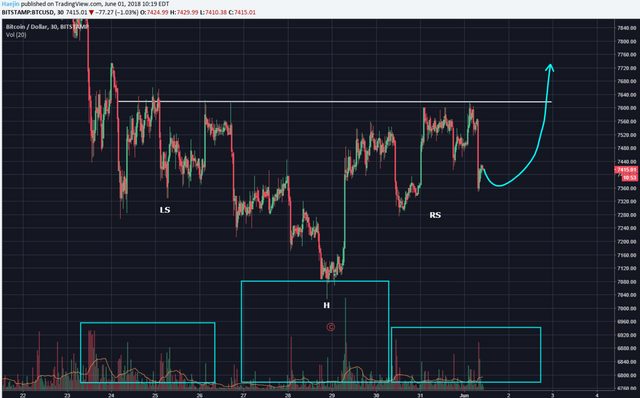
The price rose to complete the RS (Right Shoulder) and has breached the neckline. This bullish Inverted H&S has confirmed in volume, price and pattern completion. The minimum price run is set to 8'250.
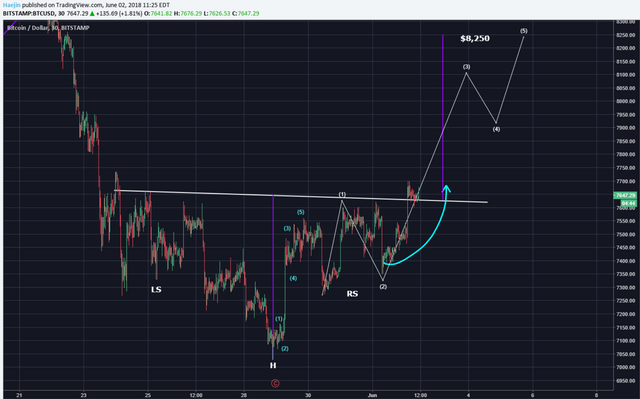
Still, keep into awareness the upward wedge (purple lines). This looks more and more out of shape as price rises and should price exceed the upper purple line as shown by the blue arrow; it would become invalidated.
The below chart is massively bullish pattern for both the price and MACD. Pattern ABCDE appears to be complete. Price might go a bit sideways to get closer to the apex but the coming explosion will be a sight to behold.
@ew-and-patterns:

Good news everyone! This is really easy right now.
If 7'350 is not breached, we have a new uptrend. This level is important now. It cannot be wave 2, if it is breached though. Then we have to revaluate. But until then, this is the count:
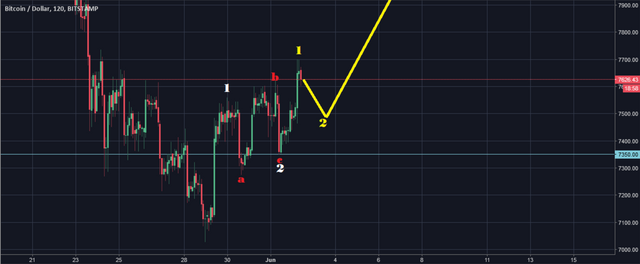
7'350 is a clear stop level for traders, because it is the invalidation point.
Notice the overshooting wave b? This often occurs in a running flat pattern like this.
The right shoulder of this inverse Head and Shoulders pattern (iSHS) is done now. A yellow wave 2 bounce fits the picture perfectly before this pattern is triggered in yellow wave 3.
@lordoftruth:
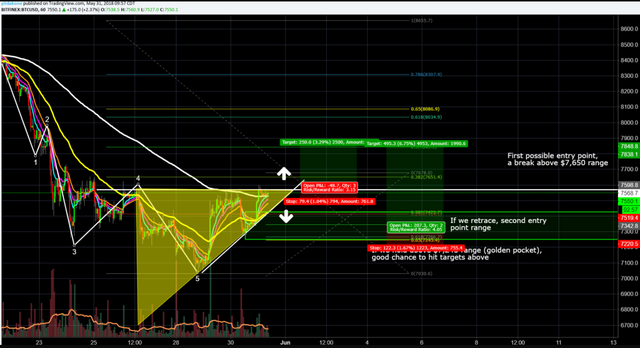
At press time, bitcoin is trading around 7'650 and the chances is still valid to achieve more decline to extend losses to reach 6'519 - 5'878 - 4'300 as long as the price below 7'910.
Bitcoin price has to break the 7'770K and 7'830 resistance levels to trade further higher. On the flip side, the downside move, will lead the price towards our targets.
He still expect the market to give in to bears for a Down Swing, and bitcoin price will surpass 7'100 - 7'210 to drop steadily towards 6'519 and the Panic Sell Below 7'000 could open the doors for price decline below 5'947 before plunging to 4'300, the potential bullish reversal location and the next bullish momentum should come in Q3/2018.
Todays trend is bearish. Trading between 6'915 and 7'910.
@philakonesteemit:
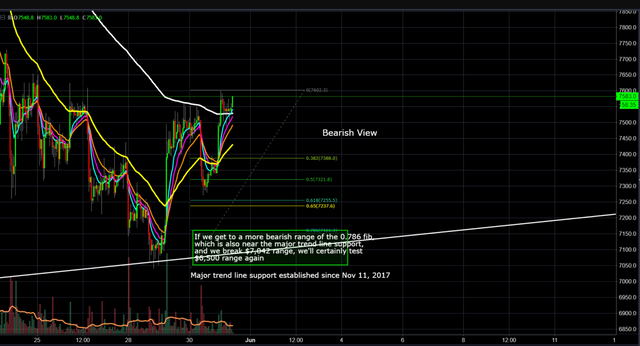
A bounce at the 7'000 level was much expected due to hitting a major trend line support established since Nov 11, 2017.
Bullish View, if we break the 7'650 range, there's a chance to hit 7'850 to 8'000 range (0.5 to 0.618 fib retracement)
Bearish View, if we break 7'161 range, we'll most likely test 7'040, which I see as failing to hold and then testing 6'500.
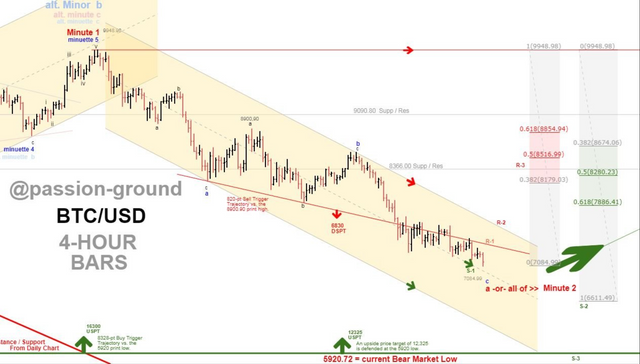
@passion-ground:
At present, BTC can’t get out of its own way. So, where is the bottom? He sees 6'830 as a possible bottom.
Summary of targets/support/resistance
Reference table
| analyst | latest content date | link to content for details |
|---|---|---|
| Tone Vays | 02. June | here |
| @haejin | 02. June | here |
| @ew-and-patterns | 02. June | here |
| @lordoftruth | 03. June | here |
| @philakonesteemit | 31. May | here |
| @passion-ground | 29. May | here |
Definition
- light blue highlighted = all content that changed since last update.
- sentiment = how in general the analysts see the current situation (bearish = lower prices more likely / bullish = higher prices more likely)
- target = the next (short term) price target an analysts mentions. This might be next day or in a few days. It might be that an analyst is bullish but sees a short term pull-back so giving nevertheless a lower (short term) target.
- support/res(istance) = Most significant support or resistances mentioned by the analysts. If those are breached a significant move to the upside or downside is expected.
- bottom = -> now renamed and moved to long term table. Low 2018
- low/top 2018 = what is the low or the top expected for 2018?
Further links for educational purposes:
- From @ToneVays: Learning trading
- From @philakonecrypto: Like in every post you find links to his amazing educational videos. For example here
- From @lordoftruth: Fibonacci Retracement
- From @haejin: Elliott Wave Counting Tutorial
*If you like me to add other analysts or add information please let me know in the comments.
informasi yang sangat bermanfaat, update BTC yang terbaru ini sangat membantu orang lain untuk lebih mudah mengetahuinya, kamu telah melakukan pekerjaan yang sangat mulia, terimakasih telah berbagi, semoga hari-hari mu sukses selalu.
Merci pour les bonnes nouvelles.
et les prévisions musclées.
good job and very noble, has given info about BTC what is understandable, thank you @famunger
Next week will know witch one forecast worked perfectly.
Very good application for checking cryptocurrency and receive notifications https://masscoinapp.com
Very good application for checking cryptocurrency and receive notifications https://masscoinapp.com