Bitcoin TA - summary of analysts - 03. August 18
Regular daily update on BTC ta analysts opinions.

**My summary - short-term (next 24h) sentiment: bearish ** (last: bearish)

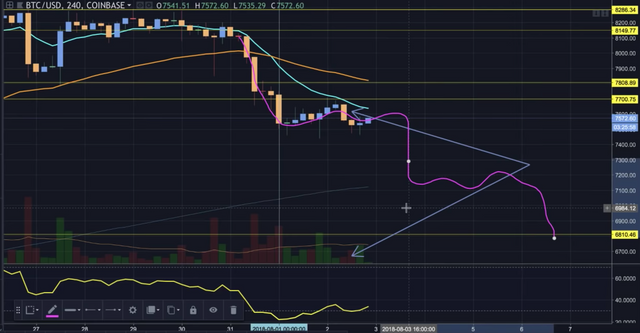
We dropped blow to 7'286.
Bear in control for now.
Very intense time ...
It seems in the war of the bears and bulls we are entering another battle: Can the bulls create enough FOMO to create distance to the lows and overcome major resistance levels? If so we are not going to see the current levels for a long time.
Or do the bears lead the bulls into a trap and than smashing hard to the downside. That would create a lot of frustration and might lead to the capitulation which you would expect to be necessary to call the bear market over.
Bull scenario*:
- This down move is "only" wave 4 turning back up above 6'800.
- That confirms a higher low.
- In the following wave 5 we go higher than last swing high to around 9'100 area overcoming the death cross.
- Volume needs to increase.
Bearish scenario*:
- We dropped from the death cross making a lower high.
- We are going down further and stay clearly below the swing high 8'500.
- After breaking 5'800 a significant drop towards new lows in the range of 4'975 and 4'300.
*scenarios based on daily-candles - so around 4-14 days timeframe. See also definition section
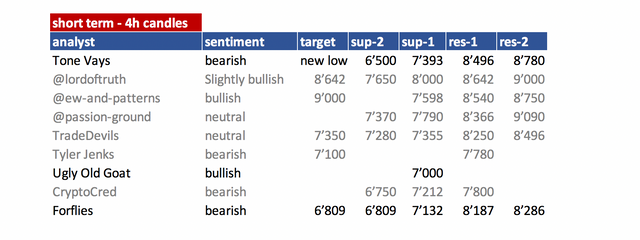
Summary of targets/support/resistance of TAs
Short-term overview
mid- and long-term overview
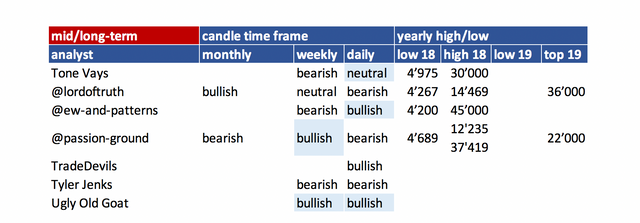
- please refer to definition section for time-horizon.
- be aware that mid- and long-term is mostly my interpretation of what analysts sentiment is as they not always clearly differentiate those time-frames. To interpret that consistently is very hard so please be kind with my interpretation.
- you can easily spot which analyst did an update
(block writing - grey ones don't have an update today).
Their changes are in light blue.
Helpful statistics:
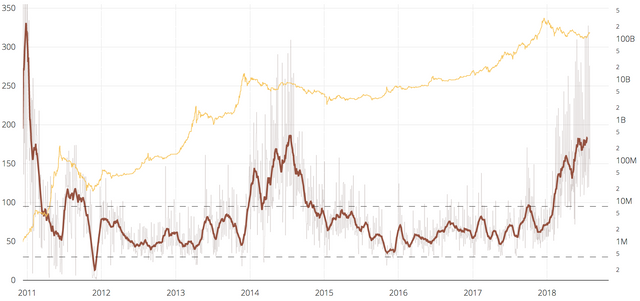
NVT ratio
Last high: July 2014 at 185.7
December 2017: 91.8
July 2018: 177.9
So the NVT is moving up to extreme levels. For those believing in this ratio this is seen as an sign of bitcoin being strongly overvalued.
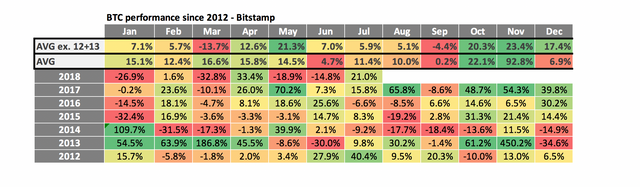
monthly performances
July was a rather decent month with +20% up - not correlating with July of other years.
August seems to be another mixed bag - lets see how it turns out.
News about the blog
- Added NVT ratio from
- if you are not familiar with it see definition section below.
- Forflies: I added him not knowing him too well - that is why his logo is in grey box - meaning under evaluation.
Analysts key statements:
Tone (bearish):
Monthly: We got rejected by 7 month MA (about the 200 MA daily). TD flipped colors. We backtested 0.618 fib and their is a > 50% chance that we now drop towards 0.764 at 4'789.
Weekly: SAR point are bullish. Bollinger bands- we are above midline last week but like before we might close this week already below.
Death cross reversed us. We made a lower high and he assumes that we are going to see a new lower low. He is waiting for us to trading and close below last weeks candle. That is his confirmation that the lower high is in.
Only chance we put in a higher low above 6'500.
Daily: Momentum indicators don't look good. RSI trending down, MACD crossing. TD is on red 3 for potential 6 more days of downside.
Area 7'500 to 7'750 is a critical area for almost 1 year. If we fall below 7'000 that is trouble.
@lordoftruth (slightly bullish):
on holiday until August 5th.

TBitcoin price fluctuates above 8'000 barrier, trying to resume the
main bullish trend ( The trend is slighty bullish as long as the price above 7'650 ) supported by Stochastic Positivity.
But the price appears to be faced some bearish pressure ( As we expected in our previous post ) before the Major Resistance at 8'642 and might be forced to retreat from the climb, to test 7.650K before the moving ( In absence of another set of positive developments to sustain the climb ) towards 38.2% FIB level near 7.050K, supported by RSI Negativity.
Todays trend is Slighty Bullish. Trading between 7'650 and 8'280.
@ew-and-patterns (bullish):
BTC is showing clear evidence of blue wave 4 coming to an end soon. This means the final wave up to complete this bigger white wave 1 is about to start soon as well.
This is ultra important! We need to see at least 8500+1 to have some confidence that this is infact an impulse wave and not some ABC correction within a bigger correction.
Blue wave 4 could be done already, but a little lower does not hurt the count at all.
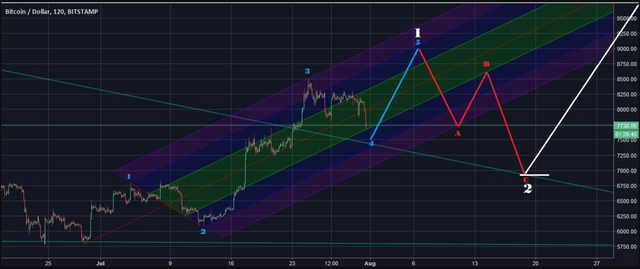
A good target for this blue wave 5 of white wave 1 would be 9000$.
White wave 2 is where I will be buying. Alts and BTC... stay tuned...
BTW: If this playes out like shown in this pic (up to 9k, then down to 7k), white wave 5 target is 13500 (if white wave 3 is 162% again) which would kill a few bearish counts (but not all of them).
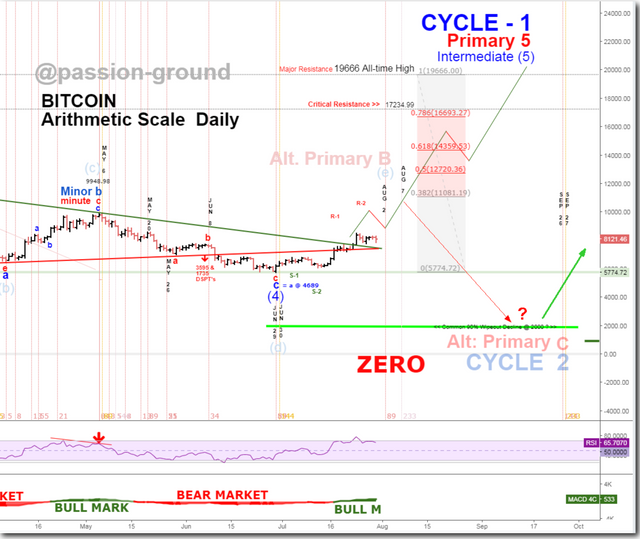
@passion-ground (neutral):
Financial markets of every stripe are like “Spinning Wheels” to one degree or another. BTC and cryptos are no different. What goes up must come down. And so on, and so on, and Scooby doo-bee doo-bee! Keep your “Blood, Sweat, and Tears” in check while riding these painted ponies – and let the spinning wheel spin!
Turn month August is upcoming. That could reverse our uptrend.
Daily: Bear Markets are dominating (MACD) - currently we are still in a bull market according to this indicator on that timeframe.
If we fall below red trendline we get a sell trigger to 3'595 - 1'735.
The most bullish count we are going up to Primary 5, Intermediate 5 to complete Cycle 1 at ATH.
The most bearish count is that we are in Cycle 2 and we come down to much lower level to complete it. Cycle 3 would have than a very bullish outlook.
TradeDevils (neutral):
The battle is on.
Bear win this one rejecting us from the 0.65
Now it is decided if we hav a 5 wave impulse up - the bull case - and we are seeing wave 4. Or if the bears won and this was an ABC correction to the upside now followed by a 5 wave impulse down.
The turning point need to be in the area of 7'700 - 7'212 level. Best if we hold the 0.5 at around 7'280.
A bull play could be to buy at 7'350 - target 9'077 - stop at 7'176. ratio 9.8
On the other hand this could be the bearish side - This being wave 1 - wave 2 is coming with not reaching up to the swing high - turning at around 8'000 and than going down for 5'800 and lower.
UglyOldGoat (bullish):
Again, I define a trend as up when trading above 2 week highs. . . so trend was up at 6850. . . today we took out last weeks lows . . . so I am now a buyer after exiting at 8000+ . . . I missed the short play . . . but I am a buyer on a scale down.. . . use your timing indicators.
Hope this helps.
UOG
Crypto Cred (bullish):
Many intraday traders (myself included) have been roughed up recently.
Let’s take a deep breath and zoom out to the 1W.
Price is currently retesting the Weekly block it broke through last week.
Low at 7200s must hold.
If this fails, next support at 6800s.
Froflies (bearish):
What is to expect is a continuation pattern bringing us down to 6'800 (purple line). That is most likely.
But we have low volume on sell candles and higher volume on the candles moving up. He sees that as a sign of strength. So that is not confirming the bearish trend.
EMA ribbon is coming down and is a resistance area.
Ishimoku cloud is concerning. It seems it is turning us again.
Reference table
| analyst | latest content date | link to content for details |
|---|---|---|
| Tone Vays | 02. Aug | here |
| @lordoftruth | 26. July | here |
| @ew-and-patterns | 31. July | here |
| @passion-ground | 23. July | here |
| @tradedevil | 01. Aug | here |
| Tyler Jenks | 18. July | here |
| UglyOldGoat | 03. Aug | here |
| CryptoCred | 31. July | here |
| Forflies | 02. Aug | here |
Definition
- light blue highlighted = all content that changed since last update.
- sentiment = how in general the analysts see the current situation (bearish = lower prices more likely / bullish = higher prices more likely). The sentiment is based on 4hr, daily, weekly, monthly candle charts.
- The forecast time horizon of candles can be compared with approx. 4hr = 1-2 days; daily = 4-14 days; weekly = 4 - 14 weeks; monthly = 4 - 14 month.
- target = the next (short term) price target an analysts mentions. This might be next day or in a few days. It might be that an analyst is bullish but sees a short term pull-back so giving nevertheless a lower (short term) target.
- support/res(istance) = Most significant support or resistances mentioned by the analysts. If those are breached a significant move to the upside or downside is expected.
- NVT Ratio = (Network Value to Transactions Ratio) is similar to the PE Ratio used in equity markets.
Educational links:
- From @ToneVays: Learning trading
- From @lordoftruth: Fibonacci Retracement
- From UglyOldGoat: How to achieve the same results of a professional trader without taking the inherent risks
- From CrytptoCred: Several great educational videos - very structured and helpful
- From @haejin: Elliott Wave Counting Tutorial
*If you like me to add other analysts or add information please let me know in the comments.
A little bit to long but very helpful.
Keep up the good work ;D
I think this is correction to 7.2k before breakining 8.6k resistant and next stop could be 9.2k
Im the 100th upvoter for you.. Following... please upvote...I'm begginer