Apparently, Bitcoin Broke Out Of The Descending Channel For The First Time Since January
As I wrote in this post, the main question of this weekend was (or still is, since we're just at the half of Sunday) if Bitcoin will finally break out of the descending channel it has been in for the last 3 and a half months.
According to this chart from Bittrex, it seems it kinda did it. At the moment of writing, it was trading for $8,350, above the psychological layer of $8,000:
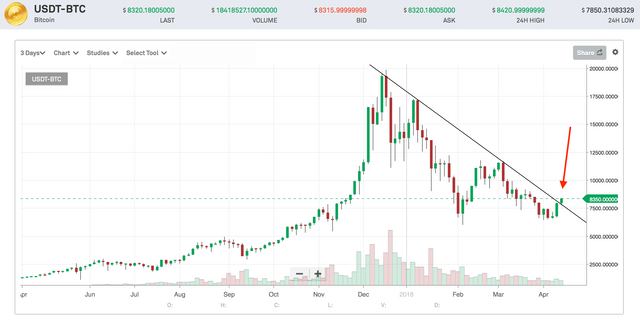
The breaking candle seems to have significant volume too.
Of course, as with anything in the crypto world, this isn't a guarantee that we're entering into a bull run immediately. Things can go south pretty fast these days, but even if they will, I would expect a much smoother bear trend than what we had so far.
The most probable scenario would be, though, one in which Bitcoin will enter a sideways trading pattern in the $8,500 - $9,500 range for a few good weeks, until some serious ammo is loaded for the bulls.
So keep that popcorn handy, you never know when you'll need it.
I'm a serial entrepreneur, blogger and ultrarunner. You can find me mainly on my blog at Dragos Roua where I write about productivity, business, relationships and running. Here on Steemit you may stay updated by following me @dragosroua.

Wanna know when you're getting paid?

|
I know the feeling. That's why I created steem.supply, an easy to use and accurate tool for calculating your Steemit rewards |
Indeed! Sideways but uptrend!
Good times are back!
We are starting the second leg of the recent uptrend started on Thursday.
Excellent news, it's a good way to start this Sunday,I did not know this but thanks to your information I am more updated
One thing I don't understand about technical analysis is that these trend lines seem to be different for everyone. For example in this recent market update post by @penguinpablo it looks like it won't break out of the descending channel until about $9,000.
It seems to all depend on your graph settings and how you draw the line...so if everyone is looking at different things how does that work?
Short answer: it doesn't. @penguinpablo used a 1 day chart, and I used a 3 days chart. Other people use logarithmic charts instead of linear ones. It's just my perspective on things, which doesn't make it automatically true.
Those are great news , i didn't really watch the market and then i saw your post , what a great surprise
Bought my poocorn...set to watch
I will become popcorn addicted soon if the market keeps making so many impossible to predict moves like it does right now :))
Wow pls shower me with more good news. What a good way to carry on with the Sunday.
I fell that bearish sentiment is slowly fading away...Major bull run may start to go with the Tim Draper's prediction...
Really? I need to google his prediction.
For your help: https://cointelegraph.com/news/cnbcs-brian-kelly-supports-tim-drapers-btc-prediction-of-250000-by-2022
Thanks a lot.