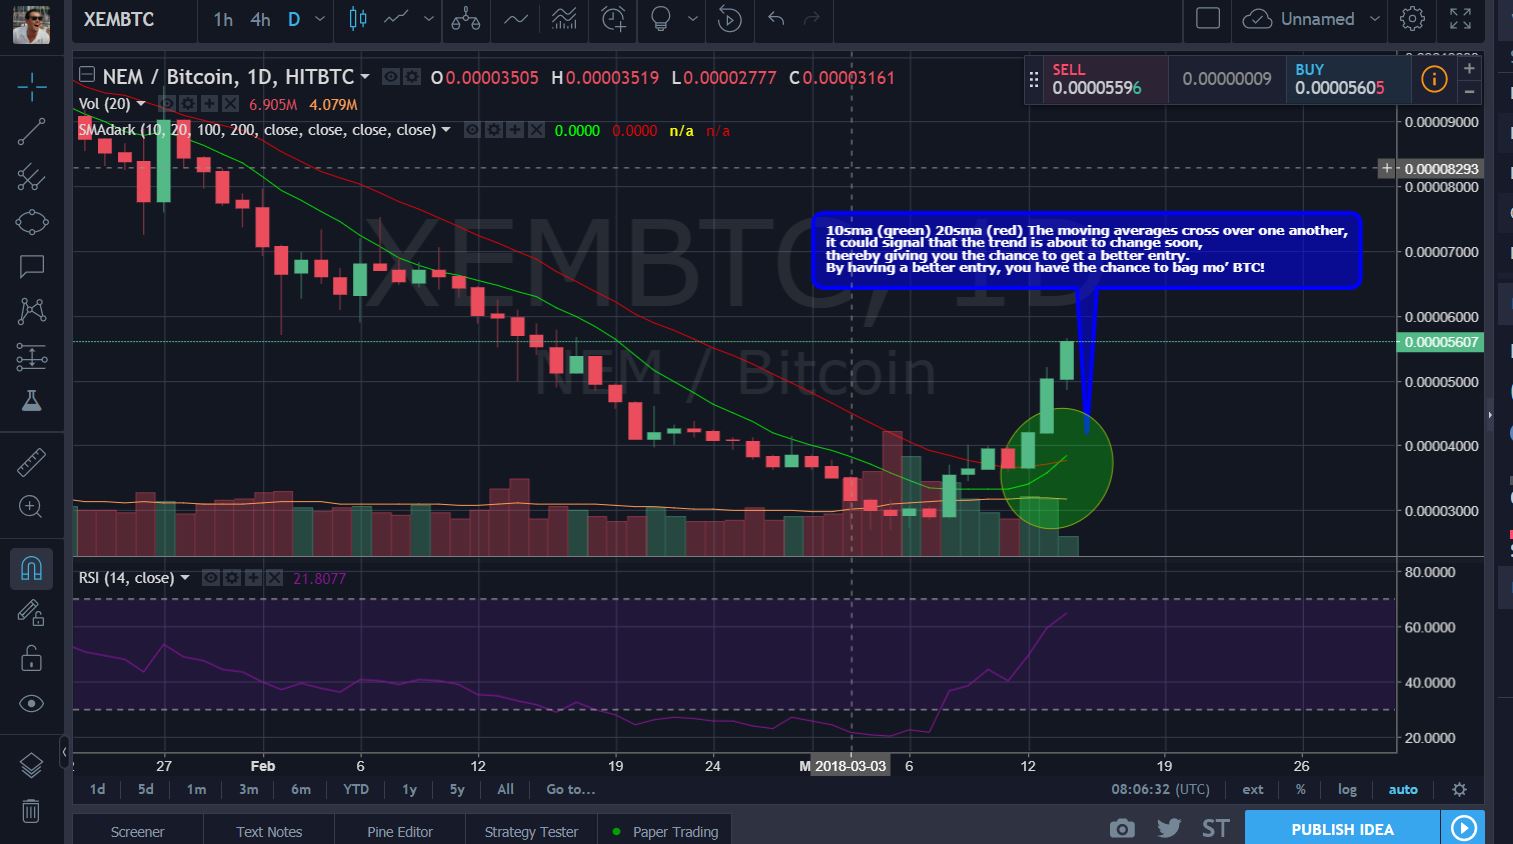
10SMA Crosses Above the 20SMA - Moving Average Crossover SIgnal - XEMBTC
It is probably one of the most well-known Technical
Analysis signals out there. The strategy basically uses
Two Moving Averages, one with a shorter period and the
other with a longer period.
A bullish signal is generated when the shorter period
Moving Average crosses the longer period Moving Average
from below.
When the opposite happens, that is when the shorter
period Moving Average crosses the longer period Moving
Average from above, we have a bearish signal.
https://www.tradingview.com/i/rLsRZAOY/
https://www.tradingview.com/chart/XEMBTC/rLsRZAOY-10SMA-Crosses-Above-the-20SMA-Moving-Average-Crossover-SIgnal/
DISCLAIMER:
I am not a financial advisor nor am I giving financial advice.
I am sharing my biased opinion based on speculation.
You should not take my opinion as financial advice.
You should always do your research before making any investment.
You should also understand the risks of investing. This is all speculative based investing.
For future viewers: price of bitcoin at the moment of posting is 9099.00USD