Chart Patterns (Triangle) How to trade them
Hey guys i want to make the community a bit more "TradingFit" so i am talking about technical Analysis and chart patterns. Today about Triangle Patterns.
A Triangle Pattern can be a continuation or a reversal pattern. Theoretically, they look pretty clean and easy to read. But in a real market, it's not that easy as we think. But later more on that.
So we distinguish between 3 Triangle Patterns
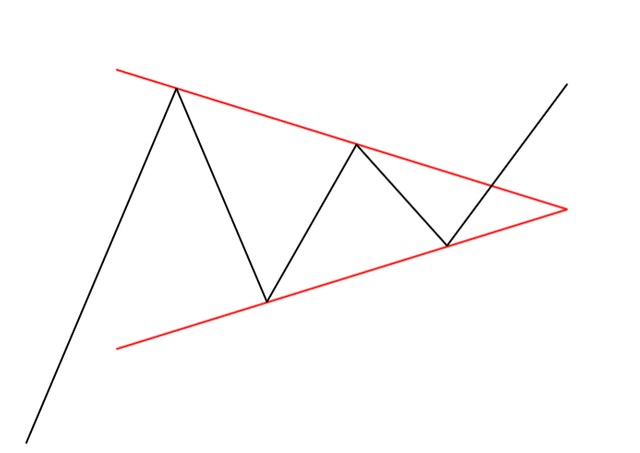
- The Symmetrical Triangle
We are talking about a Symmetrical Triangle when both trend lines move to each other and we have at least 2 high points & 2 low points which touch the trend line
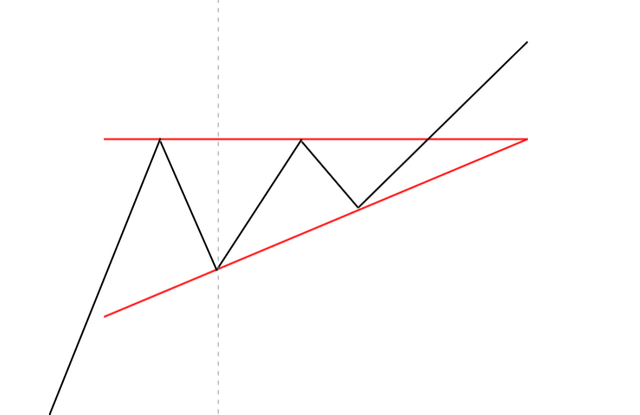
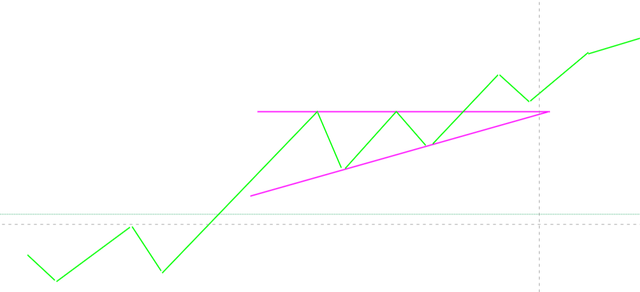
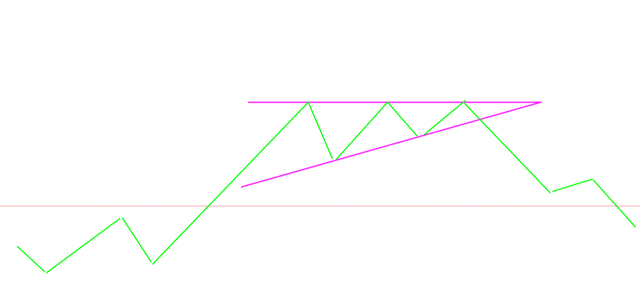
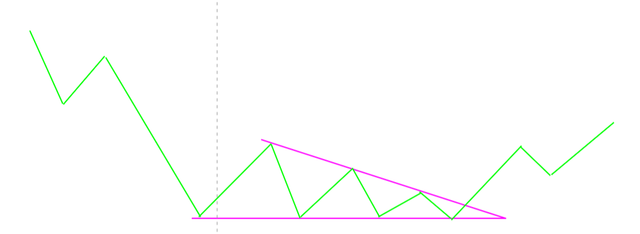
- Ascending Triangle
On an Ascending Triangle, we have a rising trendline moving to a horizontal trendline. Here we also have at least 2 high points & 2 low points which touch the trendline
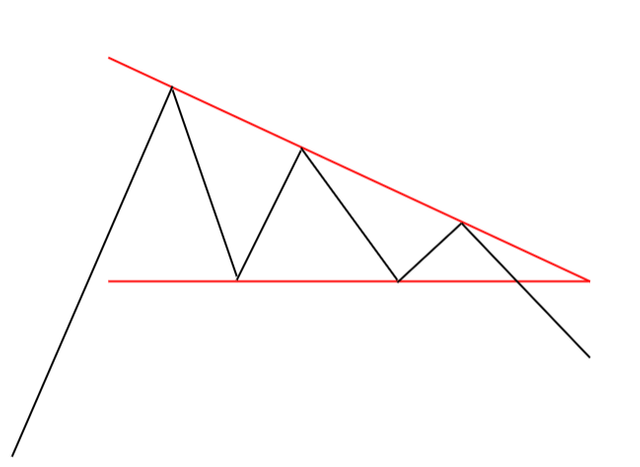
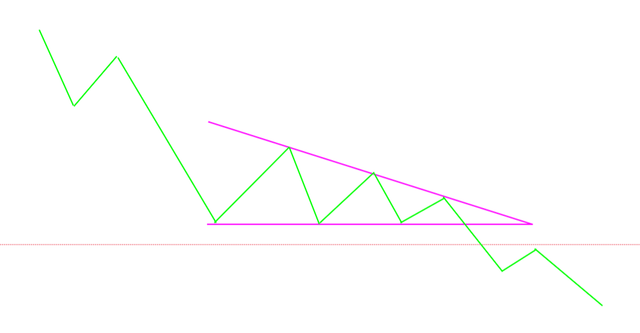
- Descending Triangle
A Descending Triangle is the opposite of an Ascending Triangle. Here we have a downward moving trendline to another horizontal trendline below. But we also have at least 2 high points & 2 low points wich touch the trendline
So now we know the 3 Triangle Patterns (Descending, Ascending & Symmetrical ). But how we do work with them.
When we have a Triangle Pattern we will always have a Breakout because the Pattern will at some Point close. There are a few scenarios which can happen.
- Bullish breakout (continuation or reversal )
- Bearish breakout (continuation or reversal )
- Sideways breakout (only in Symmetrical Triangle)
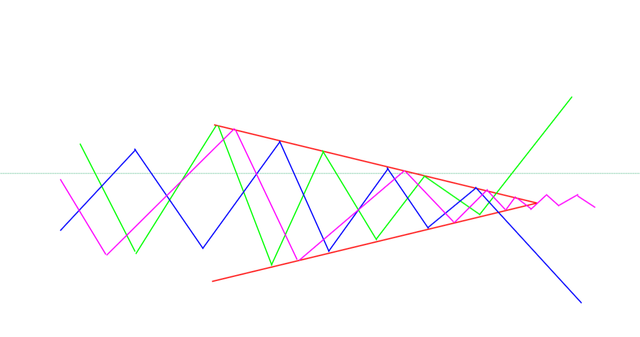
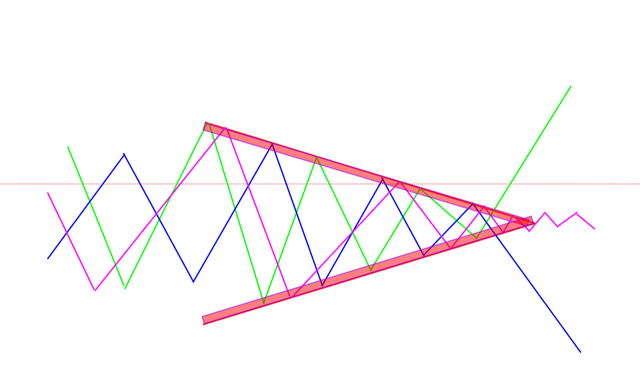
Let`s start with a Symmetrical Triangle breakout. Here we can see a few options.
- The green line shows a Bullish breakout which means we are going for a long (buy) position
- The blue line shows a Bearish breakout which means we are going for a short (sell) position
- The purple line shows a Sideways breakout which is actually the worst breakout we can get out of this triangle.
Trade a Symmetrical Triangle
As we know now what a Symmetrical Triangle is and in which directions it can breakout we need to know how we are going to trade it and where to set all important points we need.
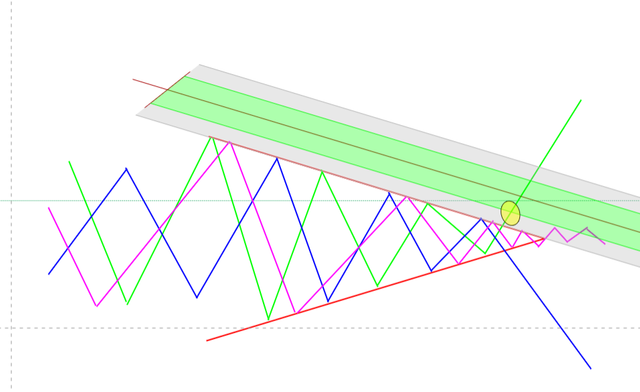
Breakout Entry Points
To set a good entry point i use a pitchfork (Median 0.75 & 1.4)
We will enter a long position (buy) as soon we will hit the green zone. This is our confidential zone. The Grey Zone is the fakeout Zone. So if we break out but we don`t make it out of the grey Zone we wait. In this case, it would be a bullish breakout.
Here we can see the opposite direction. We are facing a bearish breakout. As you can see we wait here aswell until we hit the green zone. 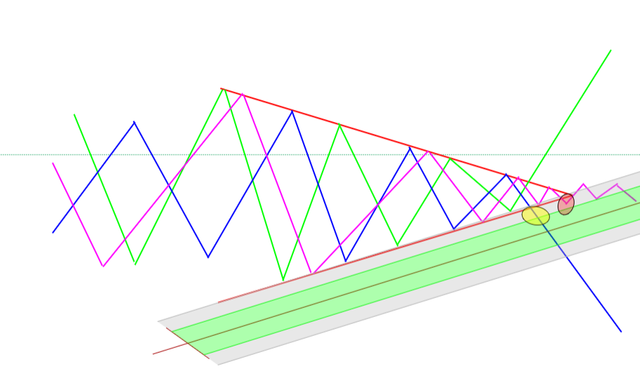
This is the most unlikely outcome. If we have a sideways breakout. As you can see we had before a so-called fakeout. We broke trough the lower trend line but we didn`t make it in our green zone. so we would have stayed away. On a Sideways breakout, we are waiting until we leave the yellow zone and recalculate the Triangle Pattern.
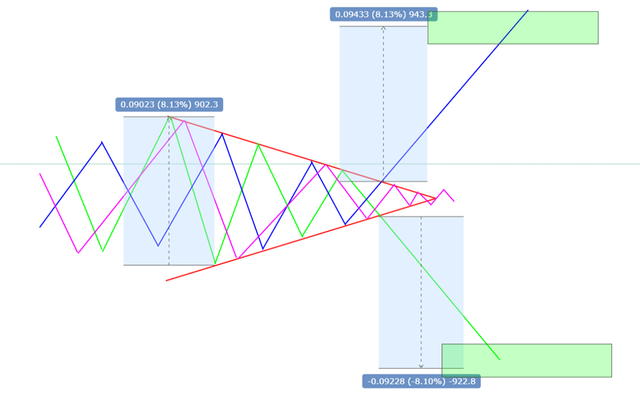
Target Zone
If we want to calculate the target zone for a breakout there is a simple and a mostly accurate way to do this. You Take the Highest point in the Pattern and the lowest point. Calculate how many Pips/Points or Percent it is and then adds it to the point where the breakout started.
Stop Loss
Now we know how to trade a Symmetric Triangle but what if something goes wrong where do we set a Stop Loss to prevent yourself from a big loss. When Peoples talk about Stop-Loss their opinion is split as wide it`s possible... I personally think it also always depends on how much you invested in that trade. For example, someone who is Trading everything with 1% of his Portfolio I personally think he doesn`t need a Stop loss at all... But someone who is trading with 50% Portfolio and also use a leverage, I would definitely recommend him a smart Stop-Loss. So overall there is no right or wrong way but let me give you an idea which I think would be smart to use.
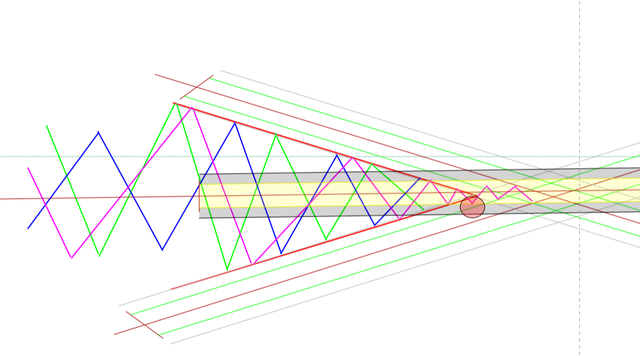
I would recommend you to use a Stop Loss Zone which is a bit below the Triangle Trendlines like you can see it on the Image.
Trade an Ascending & Descending Triangle
Trend continuation or reversal Breakout
An Ascending or Descending Triangle breaks out in a trend continuation or in a reversal. When we trade one of these Triangles we are always facing a support or resistance level. which means most of the time we are trading it during a trend.
- Here some examples a breakout could like
Ascending Triangle Trend Continuation Breakout
Ascending Triangle Trend Reversal Breakout
Descending Triangle Trend Continuation Breakout
Descending Triangle Trend Reversal Breakout
These are the possibilities a Descending or Ascending Triangle can breakout. In general, we Trade them in the same way as we trade the Symmetrical Triangle Patterns.
- Pitchfork for Entry Points and prevent from fakeouts
- Target Zones calculated on Highest and lowest point inside the Triangle
- Stop Loss zone a bit below the triangle trendline which got broken through the breakout.
Let's see how this looks in a real Market
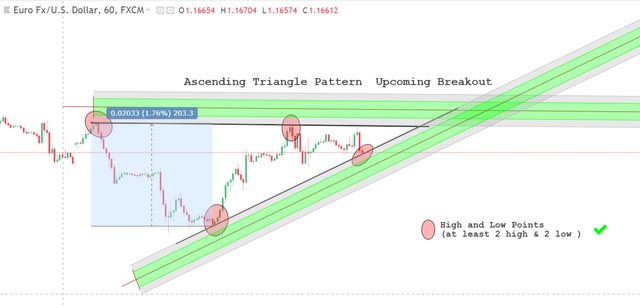
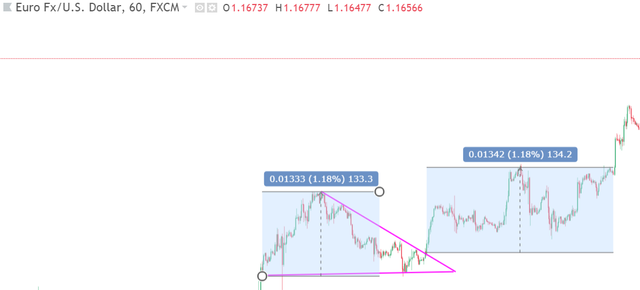
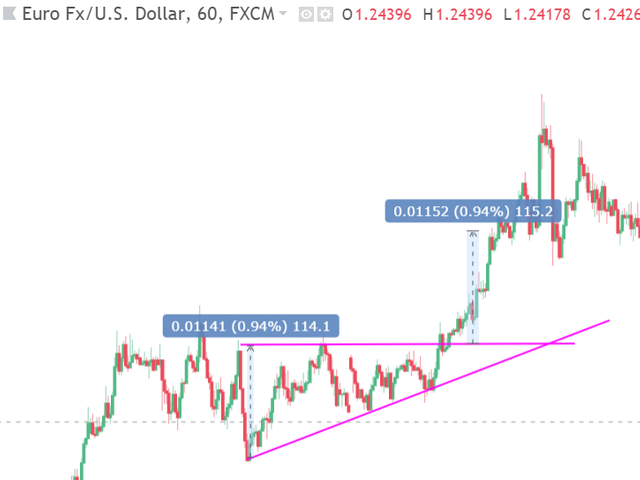
As you can see in the real market they are not that easy to spot and they do not look as perfect as in the theory. But if you are used to it someday you are able to recognize them pretty fast in the market and you get an eye for it.
Summary
I think Triangle Patterns are a really accurate and solid technical Analysis Pattern. They are simple to understand and once you get used to them you can draw them pretty fast and take your decision on a Position. I hope I could explain to you how the technical analysis of a Triangle Pattern works. If I did everything right you know now how to spot them, set entry, exit, stop loss points & you are confident with them.
Additional Notes
If you are struggling to spot a Triangle in the beginning or you don't want to spend that much time to find them. You can google the keywords “Chart Pattern Scanner” or “Chart Pattern Recognition” you may find some pretty solid software or Web sites which provides you with chart patterns. Mostly you can select to search for certain patterns like triangles.
My goal is to make the world trading fit with my blog. I try to explain everything as simple as possible and make it available for everyone. If you share this Article you can help me making more peoples Trading Fit. If you have any critic or an idea for a next article leave me a comment and I try to answer you as fast as possible or will write an article if its a certain Theme.
Daniel
Hi ,
Nice post , check my crypto blog aswell @lightreflections !
Thanks check out my new Article about Ger30 Trading https://steemit.com/trading/@danielfankhauser/cfd-ger30-trading-strategy
Nice post Steemit loves new and original content this is a good one. Well done.
Thanks check out my new Article about Ger30 Trading https://steemit.com/trading/@danielfankhauser/cfd-ger30-trading-strategy
Like the post, very helpful. How is it that you have 26 votes and only 0.44 cents. People should up their percentage or whats the point of Steemit. At least a penny, for God sakes.
Thanks check out my new Article about Ger30 Trading https://steemit.com/trading/@danielfankhauser/cfd-ger30-trading-strategy
Cool, thanks for sharing.
Thanks check out my new Article about Ger30 Trading https://steemit.com/trading/@danielfankhauser/cfd-ger30-trading-strategy
Very informative for the newbie trader in me. Let me see how I can put it to use. Thanks.
Nice article, super helpful, thanks.
Thanks check out my new Article about Ger30 Trading https://steemit.com/trading/@danielfankhauser/cfd-ger30-trading-strategy
nice article!
Thanks check out my new Article about Ger30 Trading https://steemit.com/trading/@danielfankhauser/cfd-ger30-trading-strategy
very helpful!
Tnx!
@Conovan
Thanks check out my new Article about Ger30 Trading https://steemit.com/trading/@danielfankhauser/cfd-ger30-trading-strategy
Very nice content thank you for posting. I don't nearly use stop losses as much as I probably should haha. Triangle patterns are one of the best to trade on and the easiest to spot thankfully!
Thanks check out my new Article about Ger30 Trading https://steemit.com/trading/@danielfankhauser/cfd-ger30-trading-strategy
The best project for monitoring cryptocurrency status - https://masscoinapp.com
Check the threshold value with comfort!