Bitcoin is on the risky area, if the market shows some stability NEM will explode, Ripple possible bounce area

Bitcoin is on the risky area
After last week’s rise, BTC makes a throwback (downwards move). As we said yesterday, if we drop below the round number $6,500 then we could be in trouble.
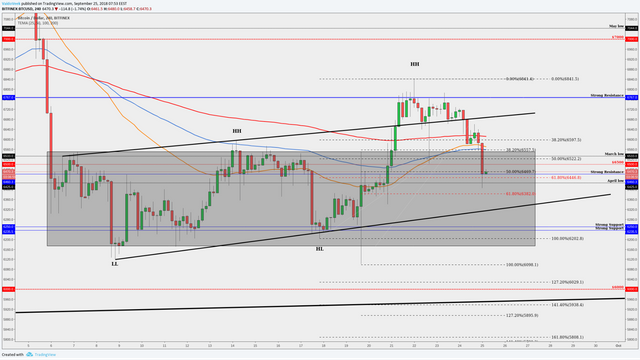
This grey area on the image is the consolidation area where Bitcoin searches for direction and this is an area where the big guys don't hide their moves, historically very big shake offs are in this area.
If we want to see a bullish BTC then it has to make a reversal some time soon. Currently, we are on the blue line which is a strong support level from our well-known support in this price zone. BTC price touched $6,400 and got a bounce, the bounce occurred upwards from the April low level and also from the Fibonacci 62 percent retracement level (pulled from Sept. 17 to Sept. 22).
Like we said, Bitcoin is on the risky area, where the breakout may happen in either direction. From this area, we have made the breakouts upwards multiple times, above the $6,500 area but now, we have a little premonition. We don't want a close below the bottom channel black trendline (the major counter-trendline), so, a close around $6,300 would be bad because if we break that major counter trendline then it will confirm the trend will continue and the overall trend is down! The full confirmation would be a candle close outside that grey area and if we get a close below that box then the $6,000 support level definitely won’t hold us.
NEM (XEM/USD)- Waiting for the big move upwards
Currently, NEM price is below the round number of $0.1 which works as a resistance. NEM has managed to break above the nearest down-trendline which now works as a support. This is a pretty significant sign because NEM has been on the big downtrend and it has not shown any big recoveries and big pumps.
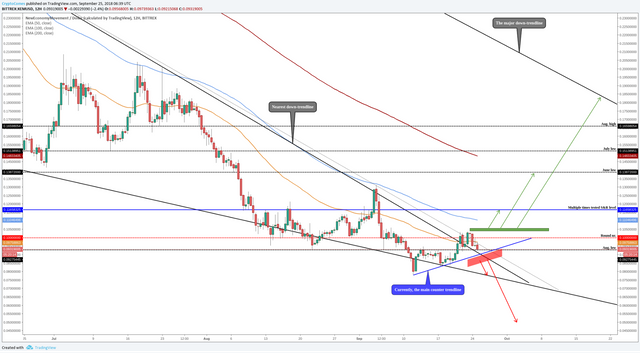
Remember what Ripple did, it exploded and from a technical perspective, one possible reason was that it was very far from the major down-trendline (not like other altcoins). As NEM stands right now, it is also far away from the major down-trendline and the possible pump may happen soon if the market starts to show some stability.
To be bullish we have to break above the round number and we have to make a short-term higher high (the green box higher high confirmation box). These first steps will guide us to the higher levels:
Blue line around $0.116- it is historically worked as a support and resistance level and the price has made reversals and stops in this price level.
The second one is around $0.14- there we start to catch some monthly levels and we need pretty good power to push through because 200 EMA comes into the play
The final target would be the major down-trendline (+100%).
The red box will confirm bearishness and is the area where you want to consider to sell your NEM. If we get a candle close below the main counter trendline and below the "nearest down-trendline" then it would be bearish confirmation and NEM would probably go and test the lower levels.
Take a look at Ripple (XRP/USD) Price Analysis, Sept. 25, 2018
Have a nice day!